|
Download Data (XLS File) |
|
||||||||
|
||||||||
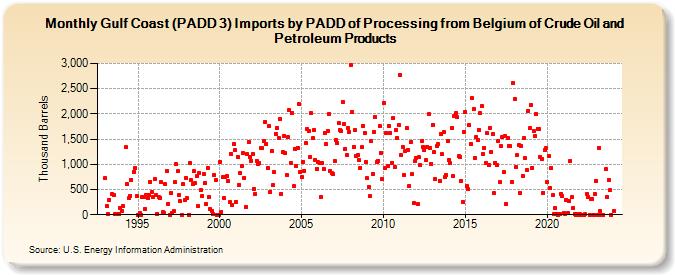
| Gulf Coast (PADD 3) Imports by PADD of Processing from Belgium of Crude Oil and Petroleum Products (Thousand Barrels) | ||||||||
| Year | Jan | Feb | Mar | Apr | May | Jun | Jul | Aug | Sep | Oct | Nov | Dec |
|---|---|---|---|---|---|---|---|---|---|---|---|---|
| 1993 | 720 | 172 | 22 | 301 | 415 | 383 | 6 | 8 | 21 | 124 | ||
| 1994 | 76 | 172 | 1,338 | 601 | 324 | 373 | 696 | 857 | 922 | 374 | ||
| 1995 | 0 | 27 | 0 | 347 | 361 | 115 | 382 | 336 | 395 | 654 | 442 | 359 |
| 1996 | 704 | 392 | 20 | 342 | 341 | 642 | 46 | 31 | 603 | 869 | 221 | 0 |
| 1997 | 430 | 27 | 66 | 647 | 999 | 860 | 389 | 266 | 0 | 602 | 295 | 732 |
| 1998 | 322 | 0 | 1,031 | 682 | 606 | 858 | 629 | 759 | 173 | 830 | 482 | 370 |
| 1999 | 812 | 627 | 208 | 927 | 348 | 107 | 80 | 21 | 787 | 683 | 0 | 0 |
| 2000 | 1,053 | 58 | 739 | 330 | 744 | 765 | 669 | 252 | 1,210 | 197 | 1,402 | 1,276 |
| 2001 | 251 | 1,151 | 597 | 830 | 962 | 1,216 | 738 | 156 | 1,200 | 1,441 | 1,150 | 1,075 |
| 2002 | 1,209 | 518 | 411 | 1,072 | 1,004 | 1,025 | 1,326 | 1,323 | 1,455 | 1,842 | 1,404 | 923 |
| 2003 | 1,751 | 451 | 1,265 | 585 | 839 | 1,610 | 1,729 | 1,525 | 1,898 | 414 | 1,237 | 1,563 |
| 2004 | 1,222 | 788 | 1,534 | 2,071 | 1,026 | 2,025 | 562 | 1,310 | 958 | 1,329 | 2,195 | 852 |
| 2005 | 752 | 1,054 | 873 | 1,422 | 1,703 | 1,663 | 1,149 | 2,017 | 1,512 | 1,684 | 1,090 | 914 |
| 2006 | 1,038 | 1,034 | 344 | 1,020 | 913 | 1,624 | 1,408 | 1,663 | 1,997 | 866 | 819 | 810 |
| 2007 | 1,074 | 1,476 | 1,415 | 1,822 | 1,681 | 1,662 | 2,237 | 1,800 | 1,307 | 1,186 | 1,714 | 1,642 |
| 2008 | 2,971 | 2,037 | 1,350 | 1,673 | 1,161 | 1,182 | 1,082 | 928 | 1,335 | 1,761 | 1,622 | 1,045 |
| 2009 | 720 | 558 | 364 | 1,456 | 807 | 1,647 | 1,938 | 1,047 | 1,072 | 1,757 | 1,233 | 708 |
| 2010 | 2,220 | 925 | 1,623 | 971 | 1,759 | 1,621 | 1,026 | 1,921 | 945 | 1,682 | 1,526 | 1,773 |
| 2011 | 2,770 | 1,182 | 1,353 | 778 | 1,260 | 1,719 | 1,293 | 571 | 1,440 | 802 | 228 | 1,070 |
| 2012 | 1,127 | 204 | 1,135 | 979 | 1,460 | 1,344 | 1,276 | 1,076 | 1,346 | 1,991 | 1,329 | 1,015 |
| 2013 | 1,788 | 1,237 | 707 | 1,359 | 1,401 | 677 | 1,605 | 1,195 | 1,642 | 745 | 789 | 1,455 |
| 2014 | 1,092 | 1,017 | 1,727 | 762 | 1,968 | 2,014 | 1,932 | 1,157 | 1,141 | 678 | 257 | 1,645 |
| 2015 | 2,042 | 563 | 503 | 1,775 | 1,405 | 2,310 | 2,089 | 1,129 | 1,539 | 1,482 | 1,690 | 2,012 |
| 2016 | 2,152 | 1,205 | 1,332 | 1,032 | 1,613 | 987 | 1,729 | 1,245 | 1,599 | 425 | 1,029 | 980 |
| 2017 | 1,467 | 640 | 1,355 | 1,535 | 839 | 1,558 | 216 | 1,519 | 1,370 | 1,356 | 656 | 2,603 |
| 2018 | 2,304 | 951 | 1,178 | 1,381 | 436 | 1,363 | 771 | 1,516 | 1,116 | 887 | 2,067 | 1,713 |
| 2019 | 2,180 | 935 | 1,659 | 1,570 | 1,996 | 1,708 | 1,702 | 1,141 | 1,113 | 436 | 1,279 | 1,314 |
| 2020 | 650 | 1,159 | 539 | 929 | 385 | 5 | 129 | 16 | 4 | 8 | 417 | 368 |
| 2021 | 37 | 14 | 290 | 39 | 276 | 1,066 | 342 | 129 | 19 | 2 | 9 | 2 |
| 2022 | 7 | 4 | 3 | 2 | 5 | 419 | 354 | 2 | 313 | 321 | 2 | 413 |
| 2023 | 676 | 2 | 1,324 | 73 | 1 | 1 | 897 | 349 | 684 | 482 | 1 | |
| - = No Data Reported; -- = Not Applicable; NA = Not Available; W = Withheld to avoid disclosure of individual company data. |
| Release Date: 3/29/2024 |
| Next Release Date: 4/30/2024 |