|
Download Data (XLS File) |
|
||||||||
|
||||||||
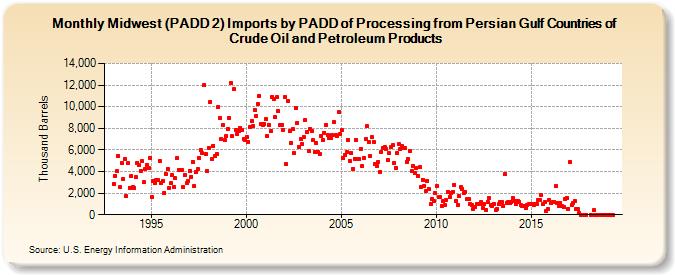
| Midwest (PADD 2) Imports by PADD of Processing from Persian Gulf Countries of Crude Oil and Petroleum Products (Thousand Barrels) | ||||||||
| Year | Jan | Feb | Mar | Apr | May | Jun | Jul | Aug | Sep | Oct | Nov | Dec |
|---|---|---|---|---|---|---|---|---|---|---|---|---|
| 1993 | 2,850 | 3,620 | 4,027 | 5,466 | 2,521 | 4,797 | 3,346 | 5,189 | 1,727 | 4,758 | 2,512 | 3,593 |
| 1994 | 2,548 | 2,512 | 3,485 | 4,829 | 4,557 | 4,089 | 4,945 | 2,998 | 4,272 | 4,613 | 4,283 | 5,221 |
| 1995 | 1,617 | 3,119 | 2,907 | 3,244 | 3,188 | 4,987 | 2,933 | 3,107 | 2,042 | 3,771 | 4,219 | 2,499 |
| 1996 | 2,893 | 3,721 | 2,545 | 3,370 | 5,249 | 4,102 | 4,161 | 4,155 | 2,579 | 3,707 | 2,945 | 3,144 |
| 1997 | 4,070 | 3,524 | 4,925 | 2,671 | 3,992 | 4,197 | 5,258 | 5,978 | 5,729 | 11,974 | 5,638 | 4,056 |
| 1998 | 6,219 | 10,461 | 5,138 | 6,388 | 5,393 | 5,609 | 9,993 | 8,952 | 7,006 | 8,291 | 6,910 | 7,286 |
| 1999 | 7,942 | 8,969 | 12,211 | 7,241 | 11,622 | 7,834 | 7,501 | 7,739 | 8,057 | 7,867 | 6,988 | 6,942 |
| 2000 | 7,212 | 6,757 | 8,160 | 8,635 | 8,223 | 9,732 | 9,178 | 10,252 | 11,028 | 8,391 | 8,261 | 8,377 |
| 2001 | 8,818 | 7,276 | 8,318 | 7,723 | 10,913 | 10,758 | 9,021 | 10,851 | 9,600 | 8,285 | 8,260 | 7,840 |
| 2002 | 10,875 | 4,682 | 10,564 | 7,720 | 6,645 | 7,900 | 5,731 | 9,886 | 8,535 | 6,266 | 7,000 | 6,571 |
| 2003 | 7,219 | 8,745 | 7,703 | 5,931 | 7,977 | 7,773 | 6,874 | 5,803 | 6,651 | 5,812 | 5,663 | 7,275 |
| 2004 | 6,904 | 7,596 | 8,317 | 7,352 | 7,097 | 7,081 | 7,366 | 8,572 | 7,336 | 7,295 | 9,523 | 7,476 |
| 2005 | 7,860 | 5,239 | 5,564 | 5,779 | 6,892 | 5,013 | 5,727 | 4,274 | 5,186 | 6,952 | 5,144 | 5,166 |
| 2006 | 6,122 | 4,525 | 5,283 | 7,027 | 8,174 | 6,759 | 5,465 | 7,157 | 6,758 | 4,719 | 4,536 | 4,889 |
| 2007 | 3,987 | 5,851 | 6,214 | 6,274 | 6,120 | 5,066 | 5,686 | 6,243 | 6,425 | 4,791 | 4,346 | 5,678 |
| 2008 | 6,521 | 6,107 | 6,366 | 6,164 | 6,149 | 4,879 | 5,130 | 5,936 | 4,029 | 4,518 | 3,901 | 4,298 |
| 2009 | 3,579 | 4,375 | 2,578 | 3,237 | 2,686 | 2,163 | 3,100 | 2,368 | 1,007 | 1,453 | 1,261 | 1,990 |
| 2010 | 2,670 | 1,625 | 1,674 | 848 | 1,224 | 867 | 1,369 | 2,097 | 1,650 | 1,998 | 2,099 | 2,792 |
| 2011 | 1,291 | 910 | 1,715 | 2,532 | 2,413 | 2,049 | 2,102 | 1,415 | 1,460 | 992 | 927 | 491 |
| 2012 | 721 | 1,020 | 987 | 999 | 1,169 | 600 | 974 | 480 | 1,193 | 1,574 | 869 | 811 |
| 2013 | 1,019 | 402 | 548 | 957 | 1,164 | 1,179 | 805 | 3,744 | 1,083 | 1,171 | 1,039 | 1,180 |
| 2014 | 1,552 | 1,230 | 1,003 | 1,308 | 1,179 | 889 | 850 | 811 | 595 | 940 | 958 | 987 |
| 2015 | 990 | 861 | 962 | 960 | 1,401 | 1,327 | 1,806 | 949 | 1,131 | 319 | 516 | 1,337 |
| 2016 | 1,101 | 1,197 | 1,199 | 2,627 | 1,100 | 802 | 1,120 | 804 | 722 | 1,465 | 1,581 | 537 |
| 2017 | 4,891 | 878 | 1,120 | 1,264 | 522 | 543 | 135 | 1 | 1 | 1 | ||
| 2018 | 1 | 401 | 1 | 1 | 1 | 1 | 1 | 1 | ||||
| 2019 | 1 | 1 | 1 | 1 | ||||||||
| - = No Data Reported; -- = Not Applicable; NA = Not Available; W = Withheld to avoid disclosure of individual company data. |
| Release Date: 3/29/2024 |
| Next Release Date: 4/30/2024 |