|
Download Data (XLS File) |
|
||||||||
|
||||||||
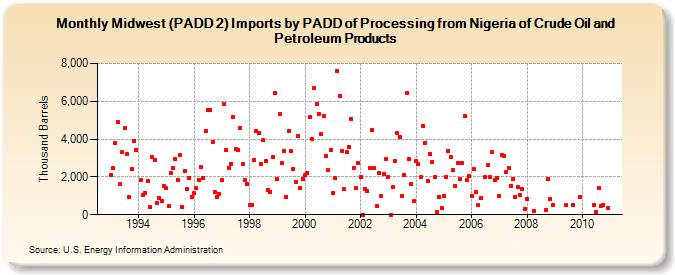
| Midwest (PADD 2) Imports by PADD of Processing from Nigeria of Crude Oil and Petroleum Products (Thousand Barrels) | ||||||||
| Year | Jan | Feb | Mar | Apr | May | Jun | Jul | Aug | Sep | Oct | Nov | Dec |
|---|---|---|---|---|---|---|---|---|---|---|---|---|
| 1993 | 2,118 | 2,448 | 3,786 | 4,890 | 1,601 | 3,293 | 4,569 | 3,187 | 914 | 2,406 | 3,909 | 3,425 |
| 1994 | 1,854 | 1,027 | 1,163 | 1,807 | 402 | 3,043 | 2,868 | 634 | 874 | 723 | 1,500 | |
| 1995 | 1,390 | 487 | 2,217 | 2,451 | 2,950 | 1,840 | 3,146 | 417 | 2,338 | 1,341 | 1,964 | 956 |
| 1996 | 1,128 | 1,402 | 1,843 | 2,512 | 1,926 | 4,442 | 5,534 | 5,525 | 3,821 | 1,181 | 947 | 1,077 |
| 1997 | 1,819 | 5,861 | 3,410 | 2,492 | 2,684 | 5,150 | 3,459 | 3,408 | 4,582 | 2,664 | 1,819 | 1,630 |
| 1998 | 540 | 501 | 2,911 | 4,403 | 4,332 | 2,686 | 3,942 | 2,815 | 1,323 | 1,210 | 3,030 | 6,448 |
| 1999 | 1,876 | 5,325 | 2,714 | 3,395 | 932 | 4,454 | 3,365 | 2,415 | 1,734 | 4,179 | 1,415 | 1,904 |
| 2000 | 2,084 | 2,202 | 5,172 | 3,988 | 6,712 | 5,861 | 5,338 | 4,266 | 5,232 | 3,086 | 2,364 | 3,438 |
| 2001 | 1,130 | 1,937 | 7,588 | 6,279 | 3,364 | 1,342 | 3,309 | 3,560 | 5,078 | 2,497 | 1,437 | 2,716 |
| 2002 | 1,987 | 0 | 1,370 | 1,235 | 2,448 | 4,459 | 2,473 | 472 | 2,192 | 972 | 2,154 | 2,930 |
| 2003 | 2,011 | 0 | 1,463 | 2,821 | 4,345 | 4,118 | 1,002 | 2,122 | 6,417 | 2,923 | 1,630 | 745 |
| 2004 | 2,843 | 2,660 | 1,992 | 4,689 | 3,813 | 1,798 | 3,199 | 2,785 | 2,005 | 150 | 950 | 353 |
| 2005 | 997 | 1,982 | 3,384 | 3,033 | 2,362 | 1,541 | 2,731 | 1,895 | 2,728 | 5,204 | 1,855 | 2,033 |
| 2006 | 993 | 2,410 | 1,194 | 499 | 906 | 1,987 | 2,617 | 2,002 | 3,321 | 1,853 | 1,925 | |
| 2007 | 998 | 3,185 | 3,109 | 2,244 | 2,496 | 1,522 | 1,898 | 948 | 1,457 | 1,017 | 1,342 | 300 |
| 2008 | 849 | 200 | 226 | 1,874 | 846 | 513 | ||||||
| 2009 | 499 | 525 | 948 | |||||||||
| 2010 | 508 | 153 | 1,425 | 472 | 498 | 345 | ||||||
| - = No Data Reported; -- = Not Applicable; NA = Not Available; W = Withheld to avoid disclosure of individual company data. |
| Release Date: 8/30/2024 |
| Next Release Date: 9/30/2024 |