|
Download Data (XLS File) |
|
||||||||
|
||||||||
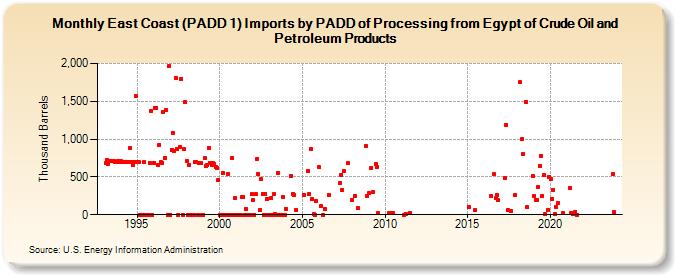
| East Coast (PADD 1) Imports by PADD of Processing from Egypt of Crude Oil and Petroleum Products (Thousand Barrels) | ||||||||
| Year | Jan | Feb | Mar | Apr | May | Jun | Jul | Aug | Sep | Oct | Nov | Dec |
|---|---|---|---|---|---|---|---|---|---|---|---|---|
| 1993 | 687 | 728 | 672 | 705 | 708 | 704 | 704 | 697 | 696 | 709 | 699 | |
| 1994 | 706 | 702 | 697 | 697 | 703 | 697 | 703 | 885 | 701 | 663 | 696 | 1,573 |
| 1995 | 696 | 693 | 0 | 1 | 0 | 694 | 0 | 0 | 0 | 688 | 1,378 | 0 |
| 1996 | 688 | 1,417 | 1,417 | 660 | 926 | 696 | 686 | 1,360 | 752 | 1,389 | 0 | 1,964 |
| 1997 | 0 | 860 | 1,081 | 840 | 1,809 | 872 | 0 | 900 | 1,794 | 0 | 866 | 1,487 |
| 1998 | 705 | 0 | 661 | 0 | 0 | 0 | 698 | 695 | 0 | 690 | 681 | 0 |
| 1999 | 0 | 746 | 638 | 654 | 888 | 684 | 652 | 678 | 672 | 633 | 623 | 460 |
| 2000 | 0 | 0 | 551 | 0 | 0 | 0 | 540 | 0 | 0 | 744 | 0 | 217 |
| 2001 | 0 | 0 | 0 | 0 | 232 | 234 | 0 | 79 | 0 | 0 | 0 | 268 |
| 2002 | 199 | 0 | 271 | 742 | 536 | 57 | 468 | 278 | 0 | 274 | 213 | 0 |
| 2003 | 0 | 219 | 0 | 268 | 15 | 0 | 557 | 0 | 0 | 0 | 236 | 0 |
| 2004 | 81 | 514 | 273 | 263 | 65 | |||||||
| 2005 | 261 | 579 | 269 | 867 | 211 | 3 | 2 | 186 | ||||
| 2006 | 627 | 115 | 2 | 73 | 258 | |||||||
| 2007 | 416 | 529 | 327 | 574 | 681 | |||||||
| 2008 | 193 | 252 | 95 | 910 | 243 | |||||||
| 2009 | 281 | 622 | 300 | 672 | 628 | 22 | ||||||
| 2010 | 22 | 22 | 22 | |||||||||
| 2011 | 1 | 14 | 23 | |||||||||
| 2015 | 96 | 56 | ||||||||||
| 2016 | 245 | 535 | 221 | 263 | 190 | |||||||
| 2017 | 487 | 1,193 | 66 | 46 | 259 | |||||||
| 2018 | 1,749 | 999 | 801 | 1,497 | 96 | 516 | ||||||
| 2019 | 248 | 200 | 198 | 371 | 649 | 778 | 252 | 523 | 11 | 65 | 501 | |
| 2020 | 472 | 212 | 325 | 4 | 106 | 150 | 23 | |||||
| 2021 | 358 | 24 | 11 | 40 | 2 | |||||||
| 2023 | 534 | 34 | ||||||||||
| - = No Data Reported; -- = Not Applicable; NA = Not Available; W = Withheld to avoid disclosure of individual company data. |
| Release Date: 3/29/2024 |
| Next Release Date: 4/30/2024 |