|
Download Data (XLS File) |
|
||||||||
|
||||||||
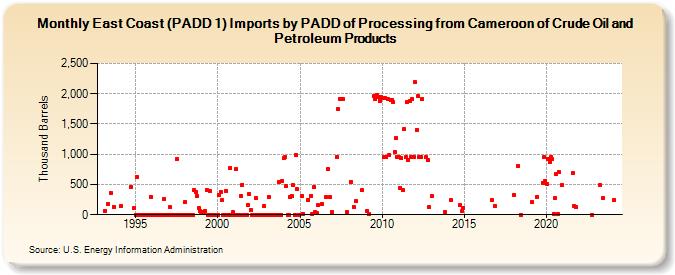
| East Coast (PADD 1) Imports by PADD of Processing from Cameroon of Crude Oil and Petroleum Products (Thousand Barrels) | ||||||||
| Year | Jan | Feb | Mar | Apr | May | Jun | Jul | Aug | Sep | Oct | Nov | Dec |
|---|---|---|---|---|---|---|---|---|---|---|---|---|
| 1993 | 69 | 170 | 367 | 132 | ||||||||
| 1994 | 143 | 460 | 108 | |||||||||
| 1995 | 0 | 630 | 0 | 0 | 0 | 0 | 0 | 0 | 0 | 0 | 0 | 297 |
| 1996 | 0 | 0 | 0 | 0 | 0 | 0 | 0 | 0 | 0 | 261 | 0 | 0 |
| 1997 | 0 | 122 | 0 | 0 | 0 | 0 | 918 | 0 | 0 | 0 | 0 | 0 |
| 1998 | 209 | 0 | 0 | 0 | 0 | 0 | 0 | 409 | 376 | 304 | 108 | 65 |
| 1999 | 45 | 45 | 36 | 59 | 414 | 0 | 395 | 0 | 0 | 0 | 0 | 0 |
| 2000 | 0 | 322 | 383 | 241 | 0 | 0 | 398 | 0 | 0 | 778 | 0 | 40 |
| 2001 | 0 | 755 | 0 | 0 | 0 | 311 | 498 | 0 | 0 | 0 | 167 | 346 |
| 2002 | 74 | 0 | 0 | 0 | 270 | 0 | 0 | 0 | 0 | 0 | 139 | 0 |
| 2003 | 0 | 296 | 0 | 0 | 0 | 0 | 0 | 0 | 0 | 549 | 0 | 561 |
| 2004 | 940 | 947 | 467 | 0 | 0 | 300 | 311 | 484 | 0 | 991 | 417 | 0 |
| 2005 | 309 | 20 | 247 | 314 | 10 | 457 | 40 | |||||
| 2006 | 25 | 156 | 180 | 289 | 751 | 290 | 40 | |||||
| 2007 | 955 | 1,745 | 1,915 | 1,910 | 1,907 | 41 | ||||||
| 2008 | 546 | 129 | 224 | 403 | ||||||||
| 2009 | 62 | 4 | 1,962 | 1,906 | 1,982 | 1,953 | 1,887 | 1,945 | ||||
| 2010 | 1,924 | 953 | 1,925 | 951 | 1,905 | 987 | 1,901 | 1,901 | 1,855 | 1,043 | 1,262 | 953 |
| 2011 | 954 | 446 | 931 | 404 | 1,418 | 953 | 1,859 | 903 | 1,879 | 954 | 1,909 | 954 |
| 2012 | 2,192 | 1,405 | 1,958 | 955 | 954 | 1,911 | 954 | 905 | 121 | |||
| 2013 | 309 | 50 | ||||||||||
| 2014 | 236 | 157 | 57 | 119 | ||||||||
| 2016 | 242 | 145 | ||||||||||
| 2018 | 329 | 813 | 2 | |||||||||
| 2019 | 204 | 299 | 527 | 947 | 561 | |||||||
| 2020 | 516 | 928 | 867 | 956 | 915 | 17 | 269 | 674 | 7 | 699 | 488 | |
| 2021 | 687 | 140 | 125 | |||||||||
| 2022 | 1 | |||||||||||
| 2023 | 493 | 269 | ||||||||||
| - = No Data Reported; -- = Not Applicable; NA = Not Available; W = Withheld to avoid disclosure of individual company data. |
| Release Date: 3/29/2024 |
| Next Release Date: 4/30/2024 |