|
Download Data (XLS File) |
|
||||||||
|
||||||||
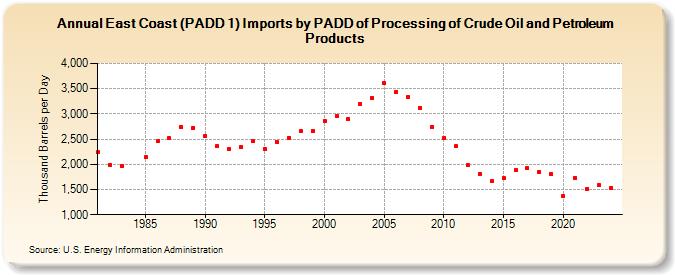
| East Coast (PADD 1) Imports by PADD of Processing of Crude Oil and Petroleum Products (Thousand Barrels per Day) | ||||||||
| Decade | Year-0 | Year-1 | Year-2 | Year-3 | Year-4 | Year-5 | Year-6 | Year-7 | Year-8 | Year-9 |
|---|---|---|---|---|---|---|---|---|---|---|
| 1980's | 2,241 | 1,994 | 1,974 | 2,137 | 2,454 | 2,516 | 2,735 | 2,728 | ||
| 1990's | 2,568 | 2,356 | 2,302 | 2,338 | 2,454 | 2,307 | 2,436 | 2,531 | 2,659 | 2,664 |
| 2000's | 2,865 | 2,967 | 2,892 | 3,194 | 3,311 | 3,607 | 3,437 | 3,334 | 3,126 | 2,741 |
| 2010's | 2,527 | 2,356 | 1,987 | 1,813 | 1,660 | 1,732 | 1,882 | 1,925 | 1,850 | 1,807 |
| 2020's | 1,367 | 1,732 | 1,517 | 1,589 |
| - = No Data Reported; -- = Not Applicable; NA = Not Available; W = Withheld to avoid disclosure of individual company data. |
| Release Date: 8/30/2024 |
| Next Release Date: 8/29/2025 |