|
Download Data (XLS File) |
|
||||||||
|
||||||||
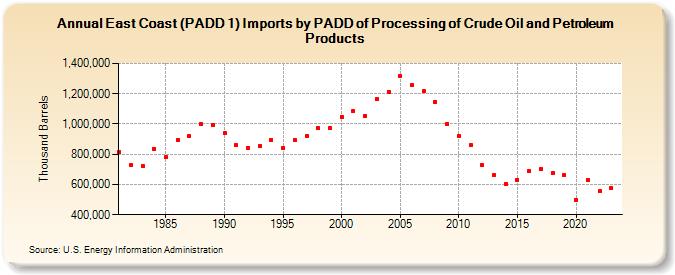
| East Coast (PADD 1) Imports by PADD of Processing of Crude Oil and Petroleum Products (Thousand Barrels) | ||||||||
| Decade | Year-0 | Year-1 | Year-2 | Year-3 | Year-4 | Year-5 | Year-6 | Year-7 | Year-8 | Year-9 |
|---|---|---|---|---|---|---|---|---|---|---|
| 1980's | 817,790 | 727,838 | 720,482 | 837,801 | 779,881 | 895,803 | 918,193 | 1,000,866 | 995,838 | |
| 1990's | 937,270 | 859,891 | 842,464 | 853,468 | 895,872 | 842,003 | 891,630 | 923,639 | 970,500 | 972,357 |
| 2000's | 1,048,451 | 1,082,866 | 1,055,682 | 1,165,761 | 1,211,663 | 1,316,400 | 1,254,666 | 1,216,790 | 1,144,024 | 1,000,432 |
| 2010's | 922,432 | 859,818 | 727,383 | 661,835 | 605,839 | 632,218 | 688,940 | 702,623 | 675,413 | 659,651 |
| 2020's | 500,157 | 632,283 | 553,555 | 579,511 |
| - = No Data Reported; -- = Not Applicable; NA = Not Available; W = Withheld to avoid disclosure of individual company data. |
| Release Date: 3/29/2024 |
| Next Release Date: 8/30/2024 |