|
Download Data (XLS File) |
|
||||||||
|
||||||||
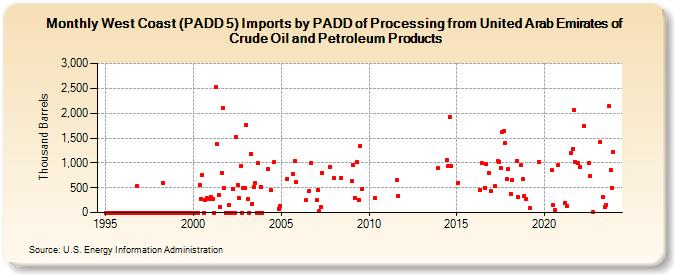
| West Coast (PADD 5) Imports by PADD of Processing from United Arab Emirates of Crude Oil and Petroleum Products (Thousand Barrels) | ||||||||
| Year | Jan | Feb | Mar | Apr | May | Jun | Jul | Aug | Sep | Oct | Nov | Dec |
|---|---|---|---|---|---|---|---|---|---|---|---|---|
| 1995 | 0 | 0 | 0 | 0 | 0 | 0 | 0 | 0 | 0 | 0 | 0 | 0 |
| 1996 | 0 | 0 | 0 | 0 | 0 | 0 | 0 | 0 | 0 | 526 | 0 | 0 |
| 1997 | 0 | 0 | 0 | 0 | 0 | 0 | 0 | 0 | 0 | 0 | 0 | 0 |
| 1998 | 0 | 0 | 0 | 599 | 0 | 0 | 0 | 0 | 0 | 0 | 0 | 0 |
| 1999 | 0 | 0 | 0 | 0 | 0 | 0 | 0 | 0 | 0 | 0 | 0 | 0 |
| 2000 | 0 | 0 | 0 | 0 | 552 | 273 | 747 | 0 | 254 | 284 | 275 | 275 |
| 2001 | 320 | 277 | 0 | 2,520 | 1,371 | 361 | 121 | 795 | 2,102 | 486 | 0 | 0 |
| 2002 | 150 | 0 | 0 | 475 | 0 | 1,526 | 564 | 286 | 941 | 0 | 497 | 499 |
| 2003 | 1,763 | 265 | 0 | 1,184 | 182 | 512 | 600 | 0 | 994 | 0 | 521 | 0 |
| 2004 | 876 | 457 | 1,009 | 77 | 140 | |||||||
| 2005 | 681 | 769 | 1,044 | 618 | ||||||||
| 2006 | 250 | 432 | 993 | |||||||||
| 2007 | 252 | 446 | 22 | 121 | 794 | 925 | ||||||
| 2008 | 700 | 700 | ||||||||||
| 2009 | 643 | 956 | 288 | 1,013 | 251 | 1,344 | 474 | |||||
| 2010 | 295 | |||||||||||
| 2011 | 657 | 339 | ||||||||||
| 2013 | 898 | |||||||||||
| 2014 | 1,055 | 941 | 1,933 | 937 | ||||||||
| 2015 | 602 | |||||||||||
| 2016 | 464 | 997 | 501 | 976 | 796 | 428 | ||||||
| 2017 | 526 | 1,029 | 1,017 | 900 | 1,630 | 1,632 | 1,397 | 670 | 870 | |||
| 2018 | 374 | 647 | 1,046 | 315 | 949 | 672 | 336 | 279 | ||||
| 2019 | 88 | 1,026 | ||||||||||
| 2020 | 850 | 148 | 56 | 948 | ||||||||
| 2021 | 194 | 135 | 1,191 | 1,288 | 2,061 | 1,027 | 997 | |||||
| 2022 | 926 | 1,732 | 997 | 733 | 10 | |||||||
| 2023 | 1,428 | 310 | 103 | 154 | 2,139 | 856 | 500 | 1,222 | ||||
| - = No Data Reported; -- = Not Applicable; NA = Not Available; W = Withheld to avoid disclosure of individual company data. |
| Release Date: 3/29/2024 |
| Next Release Date: 4/30/2024 |