|
Download Data (XLS File) |
|
||||||||
|
||||||||
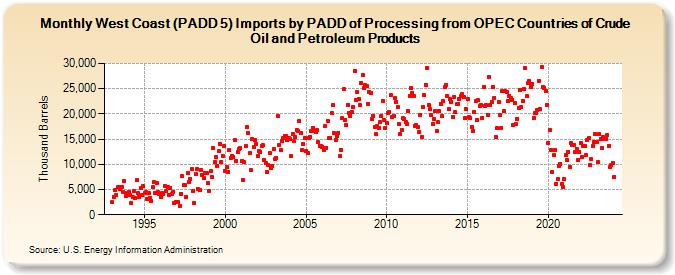
| West Coast (PADD 5) Imports by PADD of Processing from OPEC Countries of Crude Oil and Petroleum Products (Thousand Barrels) | ||||||||
| Year | Jan | Feb | Mar | Apr | May | Jun | Jul | Aug | Sep | Oct | Nov | Dec |
|---|---|---|---|---|---|---|---|---|---|---|---|---|
| 1993 | 2,456 | 3,494 | 4,834 | 3,882 | 5,483 | 5,402 | 5,036 | 5,528 | 4,479 | 6,708 | 3,783 | 4,313 |
| 1994 | 4,542 | 3,871 | 2,309 | 3,433 | 4,783 | 3,332 | 6,833 | 4,217 | 3,531 | 5,236 | 3,851 | 5,642 |
| 1995 | 4,266 | 4,465 | 3,128 | 4,312 | 3,378 | 2,684 | 5,444 | 6,465 | 4,370 | 6,361 | 4,418 | 4,104 |
| 1996 | 3,598 | 4,266 | 4,126 | 5,641 | 4,674 | 5,425 | 4,000 | 5,343 | 4,039 | 4,434 | 2,305 | 2,526 |
| 1997 | 2,525 | 2,489 | 1,631 | 4,191 | 7,599 | 5,841 | 5,881 | 3,519 | 8,258 | 6,395 | 7,160 | 9,063 |
| 1998 | 4,740 | 2,338 | 8,062 | 9,116 | 5,011 | 4,872 | 8,893 | 7,796 | 7,263 | 8,311 | 8,282 | 6,273 |
| 1999 | 4,730 | 8,573 | 7,447 | 13,216 | 10,398 | 11,541 | 9,754 | 12,542 | 14,099 | 10,520 | 11,726 | 13,547 |
| 2000 | 8,605 | 9,371 | 8,450 | 12,783 | 11,235 | 11,737 | 11,399 | 14,780 | 10,663 | 12,464 | 13,086 | 13,149 |
| 2001 | 10,610 | 6,925 | 10,378 | 13,702 | 17,301 | 16,262 | 12,169 | 8,791 | 14,950 | 13,379 | 14,731 | 13,931 |
| 2002 | 11,605 | 12,679 | 12,513 | 13,692 | 13,731 | 10,782 | 10,283 | 8,423 | 9,810 | 12,148 | 9,231 | 9,683 |
| 2003 | 12,981 | 11,042 | 11,324 | 19,622 | 13,907 | 12,831 | 14,691 | 15,212 | 15,551 | 15,700 | 14,876 | 15,223 |
| 2004 | 15,000 | 11,661 | 16,104 | 14,593 | 15,395 | 16,818 | 16,515 | 18,502 | 16,217 | 12,835 | 14,041 | 15,257 |
| 2005 | 12,543 | 12,316 | 15,281 | 15,511 | 16,690 | 17,254 | 16,524 | 16,417 | 16,749 | 14,428 | 13,695 | 13,594 |
| 2006 | 13,496 | 12,836 | 17,619 | 13,307 | 18,601 | 15,163 | 15,272 | 20,081 | 21,665 | 16,154 | 14,854 | 15,685 |
| 2007 | 16,259 | 11,625 | 12,839 | 19,114 | 24,977 | 18,879 | 17,704 | 21,815 | 20,275 | 19,649 | 20,449 | 21,362 |
| 2008 | 28,541 | 22,778 | 24,276 | 23,000 | 21,705 | 26,193 | 27,806 | 25,184 | 25,730 | 25,591 | 21,997 | 24,411 |
| 2009 | 24,230 | 18,903 | 19,617 | 17,471 | 16,109 | 17,549 | 17,293 | 18,325 | 19,676 | 22,608 | 18,695 | 17,262 |
| 2010 | 18,166 | 20,219 | 20,422 | 23,675 | 19,449 | 19,609 | 23,093 | 22,410 | 21,335 | 17,961 | 15,941 | 16,788 |
| 2011 | 19,093 | 19,066 | 18,423 | 18,069 | 20,511 | 23,637 | 25,101 | 24,105 | 23,589 | 17,603 | 17,731 | 17,335 |
| 2012 | 16,369 | 19,853 | 15,414 | 21,415 | 23,685 | 25,815 | 29,188 | 21,774 | 20,941 | 19,733 | 17,931 | 19,045 |
| 2013 | 20,537 | 16,669 | 18,335 | 20,515 | 22,029 | 19,569 | 22,527 | 25,238 | 25,775 | 23,528 | 20,911 | 22,940 |
| 2014 | 22,400 | 19,450 | 23,403 | 20,278 | 21,930 | 21,988 | 22,864 | 23,479 | 23,885 | 23,320 | 19,125 | 20,998 |
| 2015 | 22,923 | 19,307 | 19,204 | 17,405 | 16,541 | 20,373 | 22,536 | 18,788 | 22,672 | 21,508 | 21,838 | 19,267 |
| 2016 | 25,343 | 21,622 | 21,745 | 19,756 | 27,253 | 21,841 | 22,451 | 25,423 | 23,249 | 15,430 | 17,115 | 22,301 |
| 2017 | 19,772 | 17,289 | 24,501 | 20,524 | 24,458 | 24,411 | 22,532 | 23,534 | 23,094 | 22,774 | 17,815 | 22,226 |
| 2018 | 17,943 | 19,069 | 21,098 | 24,753 | 21,339 | 22,606 | 24,884 | 29,028 | 23,532 | 26,070 | 26,611 | 25,300 |
| 2019 | 26,006 | 19,126 | 20,197 | 20,148 | 20,777 | 26,615 | 20,963 | 29,215 | 25,348 | 25,192 | 24,512 | 21,826 |
| 2020 | 14,251 | 16,813 | 12,875 | 8,420 | 11,812 | 12,745 | 6,141 | 7,058 | 9,743 | 10,111 | 6,063 | 5,464 |
| 2021 | 7,031 | 11,870 | 10,803 | 12,499 | 9,512 | 14,246 | 13,750 | 13,878 | 12,515 | 13,134 | 10,928 | 12,457 |
| 2022 | 14,215 | 11,497 | 13,705 | 13,559 | 11,838 | 14,883 | 15,140 | 9,960 | 10,978 | 13,553 | 14,355 | 15,939 |
| 2023 | 14,409 | 10,372 | 16,060 | 15,033 | 13,253 | 15,334 | 15,016 | 15,117 | 15,898 | 13,722 | 9,378 | 9,954 |
| 2024 | 10,279 | |||||||||||
| - = No Data Reported; -- = Not Applicable; NA = Not Available; W = Withheld to avoid disclosure of individual company data. |
| Release Date: 3/29/2024 |
| Next Release Date: 4/30/2024 |