|
Download Data (XLS File) |
|
||||||||
|
||||||||
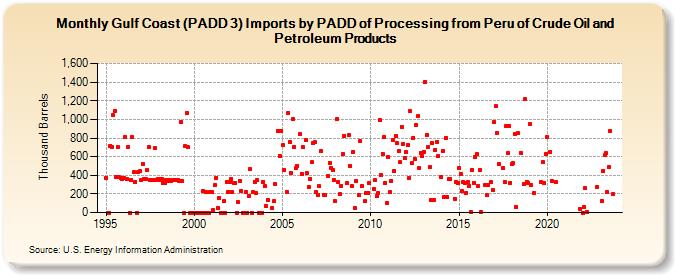
| Gulf Coast (PADD 3) Imports by PADD of Processing from Peru of Crude Oil and Petroleum Products (Thousand Barrels) | ||||||||
| Year | Jan | Feb | Mar | Apr | May | Jun | Jul | Aug | Sep | Oct | Nov | Dec |
|---|---|---|---|---|---|---|---|---|---|---|---|---|
| 1995 | 375 | 0 | 0 | 719 | 704 | 1,044 | 1,092 | 384 | 703 | 380 | 367 | 361 |
| 1996 | 373 | 810 | 360 | 706 | 0 | 353 | 813 | 435 | 332 | 0 | 430 | 441 |
| 1997 | 353 | 516 | 355 | 357 | 457 | 706 | 348 | 345 | 345 | 692 | 345 | 360 |
| 1998 | 356 | 349 | 365 | 322 | 314 | 354 | 336 | 346 | 344 | 352 | 348 | 348 |
| 1999 | 353 | 350 | 343 | 970 | 344 | 0 | 716 | 1,073 | 702 | 0 | 0 | 0 |
| 2000 | 0 | 0 | 0 | 0 | 0 | 0 | 229 | 0 | 219 | 0 | 0 | 219 |
| 2001 | 219 | 26 | 295 | 372 | 51 | 157 | 0 | 0 | 121 | 0 | 330 | 224 |
| 2002 | 327 | 358 | 218 | 317 | 320 | 0 | 110 | 344 | 229 | 0 | 0 | 219 |
| 2003 | 0 | 182 | 464 | 0 | 220 | 330 | 212 | 348 | 0 | 0 | 0 | 329 |
| 2004 | 280 | 69 | 138 | 54 | 121 | 303 | 877 | 612 | 874 | |||
| 2005 | 720 | 462 | 220 | 1,072 | 753 | 422 | 1,002 | 706 | 474 | 503 | ||
| 2006 | 839 | 419 | 700 | 775 | 421 | 279 | 363 | 538 | 742 | 752 | 219 | |
| 2007 | 188 | 281 | 656 | 190 | 188 | 392 | 537 | 482 | 455 | 352 | ||
| 2008 | 119 | 1,002 | 328 | 195 | 290 | 626 | 827 | 312 | 829 | 500 | 287 | |
| 2009 | 651 | 50 | 340 | 190 | 767 | 290 | 124 | 209 | 209 | 319 | ||
| 2010 | 254 | 346 | 176 | 209 | 992 | 402 | 633 | 814 | 317 | 105 | ||
| 2011 | 597 | 219 | 339 | 777 | 444 | 827 | 743 | 663 | 538 | 921 | 739 | 584 |
| 2012 | 650 | 724 | 370 | 1,085 | 531 | 804 | 578 | 945 | 1,036 | 482 | 643 | 605 |
| 2013 | 651 | 1,405 | 834 | 707 | 490 | 138 | 746 | 139 | 675 | 759 | 605 | |
| 2014 | 377 | 658 | 170 | 805 | 163 | 359 | 360 | 150 | 327 | 320 | ||
| 2015 | 474 | 412 | 227 | 329 | 319 | 214 | 326 | 284 | 9 | 457 | 321 | 598 |
| 2016 | 628 | 287 | 457 | 2 | 300 | 186 | 301 | 325 | 246 | |||
| 2017 | 973 | 1,142 | 852 | 519 | 479 | 329 | 927 | 634 | 928 | 320 | ||
| 2018 | 517 | 528 | 848 | 60 | 853 | 644 | 306 | 1,215 | 331 | 320 | ||
| 2019 | 947 | 301 | 207 | 330 | 539 | 315 | 625 | |||||
| 2020 | 811 | 654 | 339 | 326 | ||||||||
| 2021 | 40 | |||||||||||
| 2022 | 0 | 60 | 259 | 7 | 277 | |||||||
| 2023 | 128 | 449 | 615 | 635 | 221 | 490 | 880 | 201 | ||||
| 2024 | 382 | 156 | ||||||||||
| - = No Data Reported; -- = Not Applicable; NA = Not Available; W = Withheld to avoid disclosure of individual company data. |
| Release Date: 8/30/2024 |
| Next Release Date: 9/30/2024 |