|
Download Data (XLS File) |
|
||||||||
|
||||||||
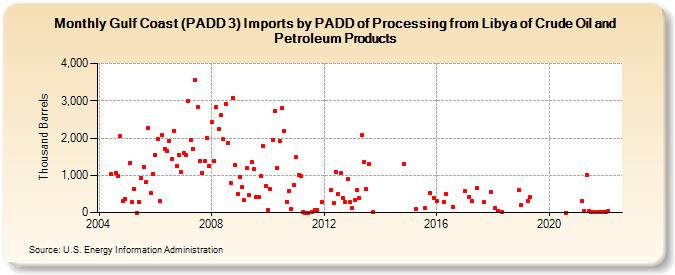
| Gulf Coast (PADD 3) Imports by PADD of Processing from Libya of Crude Oil and Petroleum Products (Thousand Barrels) | ||||||||
| Year | Jan | Feb | Mar | Apr | May | Jun | Jul | Aug | Sep | Oct | Nov | Dec |
|---|---|---|---|---|---|---|---|---|---|---|---|---|
| 2004 | 1,024 | 1,064 | 988 | 2,045 | 312 | 374 | ||||||
| 2005 | 1,341 | 292 | 643 | 1 | 280 | 933 | 1,227 | 828 | 2,267 | 522 | 1,043 | |
| 2006 | 1,551 | 1,962 | 323 | 2,073 | 1,713 | 1,651 | 1,932 | 1,441 | 2,196 | 1,260 | 1,546 | 1,083 |
| 2007 | 1,597 | 1,553 | 2,982 | 1,950 | 1,712 | 3,561 | 2,825 | 1,375 | 1,062 | 1,376 | 2,009 | 1,250 |
| 2008 | 2,427 | 1,378 | 2,820 | 2,242 | 2,605 | 1,961 | 2,909 | 1,872 | 805 | 3,077 | 1,281 | 490 |
| 2009 | 946 | 676 | 325 | 1,184 | 470 | 1,356 | 1,166 | 407 | 417 | 983 | 1,796 | 725 |
| 2010 | 68 | 629 | 1,948 | 2,723 | 1,208 | 1,922 | 2,801 | 2,182 | 293 | 581 | 86 | 738 |
| 2011 | 1,495 | 1,015 | 977 | 18 | 1 | 1 | 20 | 59 | 59 | 287 | ||
| 2012 | 596 | 250 | 1,076 | 500 | 1,049 | 385 | 280 | 908 | 281 | |||
| 2013 | 120 | 324 | 593 | 403 | 2,072 | 1,359 | 622 | 1,305 | 28 | |||
| 2014 | 1,292 | |||||||||||
| 2015 | 100 | 117 | 528 | 385 | ||||||||
| 2016 | 310 | 292 | 508 | 148 | ||||||||
| 2017 | 581 | 423 | 302 | 658 | 272 | 541 | ||||||
| 2018 | 111 | 38 | 2 | 598 | ||||||||
| 2019 | 205 | 298 | 413 | |||||||||
| 2020 | 1 | |||||||||||
| 2021 | 305 | 48 | 1,019 | 41 | 21 | 18 | 12 | 27 | 18 | |||
| 2022 | 16 | 30 | ||||||||||
| - = No Data Reported; -- = Not Applicable; NA = Not Available; W = Withheld to avoid disclosure of individual company data. |
| Release Date: 3/29/2024 |
| Next Release Date: 4/30/2024 |