|
Download Data (XLS File) |
|
||||||||
|
||||||||
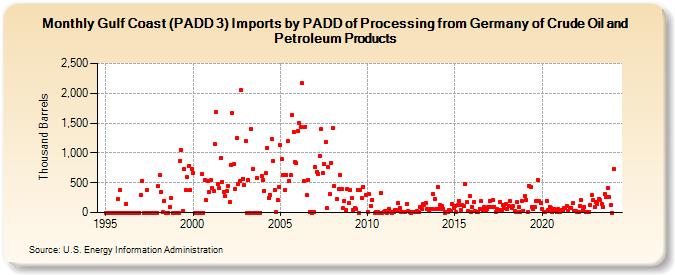
| Gulf Coast (PADD 3) Imports by PADD of Processing from Germany of Crude Oil and Petroleum Products (Thousand Barrels) | ||||||||
| Year | Jan | Feb | Mar | Apr | May | Jun | Jul | Aug | Sep | Oct | Nov | Dec |
|---|---|---|---|---|---|---|---|---|---|---|---|---|
| 1995 | 0 | 0 | 0 | 0 | 0 | 0 | 0 | 0 | 230 | 0 | 370 | 1 |
| 1996 | 0 | 0 | 151 | 0 | 0 | 0 | 0 | 0 | 0 | 0 | 0 | 0 |
| 1997 | 300 | 533 | 1 | 0 | 374 | 0 | 0 | 0 | 0 | 0 | 0 | 0 |
| 1998 | 440 | 622 | 347 | 2 | 195 | 1 | 0 | 0 | 101 | 237 | 0 | 0 |
| 1999 | 0 | 0 | 0 | 873 | 1,046 | 29 | 729 | 377 | 589 | 781 | 375 | 723 |
| 2000 | 664 | 0 | 0 | 0 | 0 | 0 | 646 | 0 | 551 | 203 | 533 | 352 |
| 2001 | 538 | 410 | 369 | 1,144 | 1,686 | 472 | 406 | 908 | 520 | 345 | 271 | 366 |
| 2002 | 445 | 175 | 800 | 1,665 | 807 | 401 | 1,252 | 481 | 526 | 2,049 | 571 | 461 |
| 2003 | 1,195 | 0 | 544 | 0 | 1,403 | 728 | 0 | 0 | 576 | 0 | 0 | 607 |
| 2004 | 543 | 368 | 657 | 1,091 | 248 | 301 | 1,233 | 864 | 382 | 9 | 213 | 437 |
| 2005 | 1,135 | 896 | 631 | 380 | 636 | 1,195 | 528 | 625 | 1,642 | 1,356 | 845 | 829 |
| 2006 | 1,366 | 1,499 | 1,433 | 2,166 | 522 | 1,442 | 294 | 546 | 10 | 9 | 1 | 9 |
| 2007 | 758 | 687 | 648 | 946 | 1,393 | 657 | 817 | 1,187 | 69 | 756 | 308 | 828 |
| 2008 | 1,417 | 446 | 224 | 393 | 628 | 402 | 69 | 195 | 44 | 393 | 167 | |
| 2009 | 379 | 241 | 50 | 69 | 52 | 384 | 1 | 382 | 242 | 429 | 299 | |
| 2010 | 9 | 304 | 117 | 216 | 1 | 2 | 4 | 1 | 320 | 1 | 9 | |
| 2011 | 20 | 1 | 27 | 52 | 16 | 1 | 15 | 41 | 46 | 159 | 83 | 9 |
| 2012 | 4 | 5 | 15 | 148 | 25 | 17 | 1 | 5 | 2 | 16 | 25 | 11 |
| 2013 | 96 | 59 | 142 | 130 | 162 | 52 | 24 | 62 | 61 | 317 | 227 | 55 |
| 2014 | 436 | 56 | 119 | 110 | 67 | 1 | 11 | 16 | 48 | 29 | 143 | 81 |
| 2015 | 114 | 5 | 128 | 197 | 49 | 121 | 103 | 474 | 181 | 19 | 272 | 16 |
| 2016 | 92 | 175 | 23 | 5 | 5 | 65 | 188 | 50 | 86 | 25 | 60 | 98 |
| 2017 | 199 | 85 | 206 | 98 | 4 | 52 | 35 | 179 | 51 | 132 | 69 | 140 |
| 2018 | 62 | 103 | 189 | 79 | 105 | 24 | 8 | 177 | 91 | 17 | 195 | 31 |
| 2019 | 283 | 218 | 5 | 452 | 437 | 90 | 67 | 89 | 193 | 553 | 194 | 154 |
| 2020 | 65 | 2 | 17 | 197 | 43 | 101 | 82 | 2 | 58 | 47 | 16 | 59 |
| 2021 | 2 | 51 | 34 | 82 | 84 | 105 | 32 | 72 | 76 | 154 | 29 | 25 |
| 2022 | 17 | 4 | 113 | 203 | 50 | 91 | 16 | 6 | 5 | 129 | 299 | 210 |
| 2023 | 86 | 172 | 149 | 233 | 206 | 146 | 96 | 314 | 261 | 404 | 258 | 121 |
| 2024 | 1 | 735 | 150 | 173 | 97 | 151 | ||||||
| - = No Data Reported; -- = Not Applicable; NA = Not Available; W = Withheld to avoid disclosure of individual company data. |
| Release Date: 8/30/2024 |
| Next Release Date: 9/30/2024 |