|
Download Data (XLS File) |
|
||||||||
|
||||||||
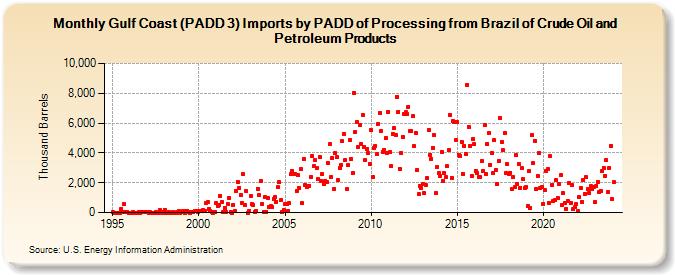
| Gulf Coast (PADD 3) Imports by PADD of Processing from Brazil of Crude Oil and Petroleum Products (Thousand Barrels) | ||||||||
| Year | Jan | Feb | Mar | Apr | May | Jun | Jul | Aug | Sep | Oct | Nov | Dec |
|---|---|---|---|---|---|---|---|---|---|---|---|---|
| 1995 | 30 | 0 | 0 | 0 | 0 | 0 | 250 | 21 | 565 | 35 | 41 | 0 |
| 1996 | 0 | 0 | 37 | 4 | 0 | 0 | 46 | 0 | 12 | 27 | 22 | 34 |
| 1997 | 30 | 0 | 36 | 0 | 0 | 0 | 59 | 0 | 0 | 147 | 48 | 0 |
| 1998 | 191 | 0 | 0 | 43 | 0 | 0 | 43 | 0 | 0 | 35 | 85 | 0 |
| 1999 | 42 | 82 | 0 | 99 | 110 | 17 | 0 | 63 | 37 | 95 | 105 | 66 |
| 2000 | 78 | 107 | 84 | 184 | 110 | 646 | 686 | 268 | 80 | 20 | 0 | 64 |
| 2001 | 644 | 426 | 486 | 1,144 | 715 | 38 | 325 | 41 | 580 | 994 | 28 | 0 |
| 2002 | 506 | 72 | 1,479 | 2,064 | 1,670 | 1,181 | 663 | 2,565 | 505 | 1,418 | 0 | 137 |
| 2003 | 1,142 | 541 | 476 | 40 | 119 | 1,606 | 1,164 | 2,126 | 595 | 64 | 1,032 | 70 |
| 2004 | 988 | 406 | 433 | 361 | 914 | 1,040 | 730 | 1,692 | 2,029 | 815 | 11 | 193 |
| 2005 | 552 | 589 | 137 | 627 | 2,572 | 2,790 | 2,600 | 2,595 | 1,461 | 2,530 | 1,634 | 2,926 |
| 2006 | 632 | 3,587 | 1,881 | 1,747 | 1,808 | 1,815 | 2,408 | 3,819 | 3,100 | 3,498 | 2,960 | 2,225 |
| 2007 | 3,714 | 2,103 | 2,582 | 1,894 | 2,124 | 2,047 | 3,302 | 4,572 | 2,375 | 3,679 | 1,581 | 4,011 |
| 2008 | 3,709 | 2,154 | 2,992 | 3,174 | 4,780 | 5,280 | 3,515 | 1,559 | 3,194 | 4,876 | 3,596 | 2,650 |
| 2009 | 8,047 | 5,437 | 6,077 | 4,417 | 5,889 | 4,583 | 6,561 | 4,430 | 3,513 | 4,281 | 3,984 | 3,244 |
| 2010 | 5,525 | 2,399 | 4,345 | 4,432 | 3,920 | 5,957 | 6,702 | 5,500 | 4,083 | 4,220 | 5,015 | 4,016 |
| 2011 | 6,767 | 4,054 | 3,094 | 5,293 | 5,649 | 5,234 | 7,757 | 6,769 | 2,924 | 3,998 | 5,096 | 6,635 |
| 2012 | 6,716 | 6,637 | 7,110 | 5,467 | 5,465 | 6,461 | 4,445 | 5,358 | 2,851 | 1,243 | 1,776 | 1,632 |
| 2013 | 1,913 | 1,279 | 1,874 | 2,310 | 5,527 | 3,890 | 3,611 | 4,352 | 5,197 | 1,302 | 3,084 | 2,632 |
| 2014 | 2,464 | 4,094 | 2,132 | 2,624 | 2,391 | 3,105 | 4,189 | 6,575 | 2,346 | 6,121 | 6,059 | 4,836 |
| 2015 | 6,071 | 3,863 | 3,805 | 4,756 | 2,615 | 4,474 | 3,948 | 8,578 | 5,765 | 4,489 | 2,467 | 4,905 |
| 2016 | 4,570 | 2,814 | 2,648 | 2,391 | 2,365 | 3,461 | 2,820 | 5,875 | 2,572 | 4,621 | 5,321 | 3,218 |
| 2017 | 3,991 | 2,678 | 4,847 | 2,883 | 1,890 | 3,475 | 6,366 | 4,736 | 4,169 | 5,318 | 2,643 | 3,239 |
| 2018 | 2,565 | 2,686 | 1,599 | 2,374 | 1,695 | 3,839 | 1,903 | 3,229 | 1,665 | 2,972 | 2,223 | 1,679 |
| 2019 | 1,722 | 428 | 2,767 | 307 | 5,185 | 3,312 | 4,811 | 1,574 | 2,474 | 4,015 | 1,627 | 1,692 |
| 2020 | 585 | 1,506 | 2,816 | 2,903 | 671 | 3,771 | 1,882 | 748 | 870 | 2,173 | 972 | 1,907 |
| 2021 | 2,487 | 512 | 1,304 | 636 | 261 | 800 | 1,993 | 624 | 1,825 | 247 | 349 | 542 |
| 2022 | 121 | 1,016 | 1,636 | 741 | 2,174 | 1,264 | 2,365 | 1,561 | 1,309 | 1,756 | 1,563 | 1,740 |
| 2023 | 677 | 1,813 | 2,073 | 1,363 | 1,450 | 2,768 | 3,008 | 2,456 | 3,513 | 1,383 | 3,017 | 4,484 |
| 2024 | 902 | 2,032 | 1,963 | 2,015 | 3,042 | 1,978 | ||||||
| - = No Data Reported; -- = Not Applicable; NA = Not Available; W = Withheld to avoid disclosure of individual company data. |
| Release Date: 8/30/2024 |
| Next Release Date: 9/30/2024 |