|
Download Data (XLS File) |
|
||||||||
|
||||||||
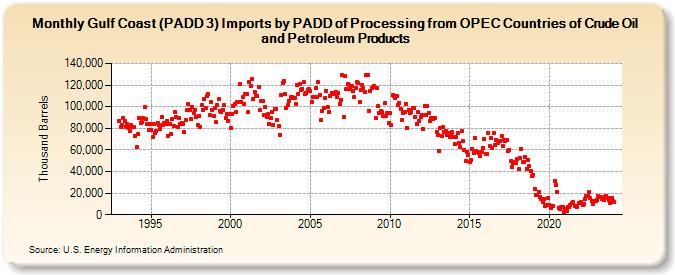
| Gulf Coast (PADD 3) Imports by PADD of Processing from OPEC Countries of Crude Oil and Petroleum Products (Thousand Barrels) | ||||||||
| Year | Jan | Feb | Mar | Apr | May | Jun | Jul | Aug | Sep | Oct | Nov | Dec |
|---|---|---|---|---|---|---|---|---|---|---|---|---|
| 1993 | 86,982 | 81,037 | 82,816 | 89,556 | 86,386 | 81,024 | 84,101 | 80,566 | 77,621 | 82,591 | 80,803 | 81,160 |
| 1994 | 72,817 | 62,451 | 74,914 | 89,391 | 85,249 | 85,649 | 89,586 | 99,977 | 88,164 | 83,889 | 78,552 | 84,226 |
| 1995 | 77,976 | 72,385 | 83,785 | 75,647 | 77,042 | 84,899 | 82,708 | 79,462 | 90,314 | 83,128 | 84,733 | 84,211 |
| 1996 | 86,788 | 72,579 | 83,805 | 74,637 | 88,469 | 81,663 | 94,848 | 90,475 | 81,483 | 89,241 | 84,077 | 85,282 |
| 1997 | 84,296 | 76,728 | 87,482 | 96,593 | 102,148 | 96,809 | 88,335 | 100,057 | 94,382 | 97,023 | 90,284 | 83,128 |
| 1998 | 91,721 | 81,298 | 101,235 | 96,737 | 107,196 | 98,767 | 110,104 | 111,417 | 91,908 | 104,062 | 97,166 | 91,052 |
| 1999 | 98,616 | 85,414 | 101,687 | 106,942 | 96,317 | 95,256 | 96,876 | 101,186 | 89,265 | 93,583 | 86,835 | 93,034 |
| 2000 | 80,270 | 93,241 | 100,342 | 102,765 | 94,820 | 104,174 | 104,403 | 120,749 | 104,639 | 108,566 | 102,315 | 111,921 |
| 2001 | 111,733 | 95,040 | 123,003 | 118,744 | 125,225 | 107,524 | 113,596 | 110,315 | 109,671 | 118,660 | 96,557 | 105,092 |
| 2002 | 105,677 | 92,106 | 99,535 | 90,193 | 93,367 | 84,209 | 89,118 | 94,964 | 83,426 | 97,929 | 98,059 | 87,498 |
| 2003 | 81,830 | 74,138 | 110,550 | 121,956 | 123,563 | 111,509 | 98,349 | 101,229 | 105,148 | 108,619 | 109,033 | 107,625 |
| 2004 | 108,418 | 102,132 | 119,820 | 111,763 | 120,607 | 115,561 | 116,687 | 122,446 | 111,757 | 112,837 | 115,720 | 116,327 |
| 2005 | 114,181 | 103,975 | 108,563 | 109,142 | 117,225 | 108,852 | 122,502 | 110,594 | 87,660 | 95,917 | 98,357 | 107,989 |
| 2006 | 114,101 | 99,815 | 95,303 | 109,951 | 113,084 | 111,993 | 111,950 | 113,334 | 108,547 | 112,253 | 102,692 | 105,914 |
| 2007 | 129,022 | 90,359 | 128,844 | 116,128 | 120,740 | 119,634 | 116,467 | 119,187 | 114,796 | 108,581 | 117,506 | 122,937 |
| 2008 | 122,261 | 104,782 | 115,505 | 120,506 | 117,195 | 113,381 | 129,430 | 129,545 | 96,460 | 114,916 | 117,276 | 118,021 |
| 2009 | 118,756 | 89,545 | 117,179 | 100,580 | 94,305 | 96,414 | 95,279 | 91,763 | 102,972 | 91,607 | 94,343 | 84,701 |
| 2010 | 93,980 | 82,639 | 110,449 | 109,442 | 107,682 | 110,090 | 101,866 | 103,765 | 98,270 | 87,469 | 93,810 | 95,410 |
| 2011 | 102,855 | 80,165 | 97,357 | 94,089 | 95,315 | 98,603 | 98,788 | 90,420 | 84,140 | 94,832 | 86,675 | 90,559 |
| 2012 | 91,849 | 79,184 | 101,050 | 92,581 | 100,648 | 94,214 | 86,681 | 89,727 | 88,363 | 89,230 | 89,300 | 76,868 |
| 2013 | 74,223 | 59,070 | 80,006 | 72,856 | 80,996 | 76,783 | 77,389 | 73,468 | 75,682 | 71,983 | 73,992 | 76,306 |
| 2014 | 71,951 | 65,373 | 71,800 | 75,707 | 66,757 | 63,014 | 77,778 | 67,868 | 60,194 | 50,018 | 58,430 | 55,089 |
| 2015 | 48,400 | 50,742 | 60,942 | 57,366 | 70,806 | 58,689 | 57,641 | 57,174 | 54,143 | 58,414 | 61,667 | 70,410 |
| 2016 | 56,057 | 56,568 | 75,496 | 63,164 | 70,938 | 61,683 | 75,572 | 64,823 | 69,143 | 65,962 | 68,627 | 67,902 |
| 2017 | 73,053 | 63,243 | 68,960 | 68,626 | 68,731 | 58,612 | 60,290 | 49,602 | 44,096 | 47,915 | 49,090 | 48,005 |
| 2018 | 51,194 | 42,473 | 52,521 | 60,498 | 48,380 | 48,786 | 53,466 | 42,472 | 50,992 | 45,554 | 40,155 | 35,917 |
| 2019 | 37,001 | 24,020 | 18,580 | 18,417 | 20,659 | 16,476 | 14,549 | 11,574 | 14,125 | 8,467 | 8,919 | 15,283 |
| 2020 | 9,017 | 6,521 | 8,134 | 7,617 | 31,076 | 27,080 | 20,718 | 6,416 | 5,442 | 6,767 | 6,967 | 2,856 |
| 2021 | 5,170 | 3,666 | 7,290 | 7,446 | 8,541 | 10,397 | 11,956 | 8,048 | 7,917 | 6,795 | 10,782 | 10,406 |
| 2022 | 11,797 | 9,016 | 10,320 | 14,210 | 17,588 | 17,601 | 20,581 | 15,104 | 12,424 | 10,132 | 12,900 | 12,917 |
| 2023 | 13,763 | 17,235 | 16,188 | 16,710 | 14,122 | 13,241 | 16,290 | 17,183 | 15,856 | 13,538 | 10,998 | 15,876 |
| 2024 | 12,917 | |||||||||||
| - = No Data Reported; -- = Not Applicable; NA = Not Available; W = Withheld to avoid disclosure of individual company data. |
| Release Date: 3/29/2024 |
| Next Release Date: 4/30/2024 |