|
Download Data (XLS File) |
|
||||||||
|
||||||||
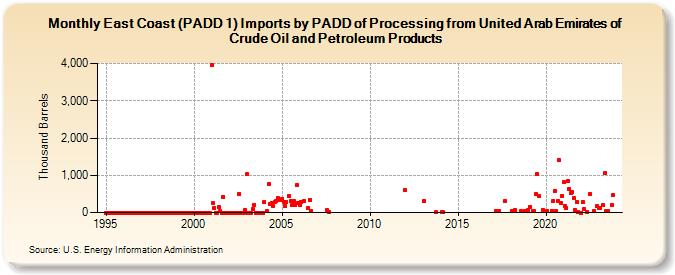
| East Coast (PADD 1) Imports by PADD of Processing from United Arab Emirates of Crude Oil and Petroleum Products (Thousand Barrels) | ||||||||
| Year | Jan | Feb | Mar | Apr | May | Jun | Jul | Aug | Sep | Oct | Nov | Dec |
|---|---|---|---|---|---|---|---|---|---|---|---|---|
| 1995 | 0 | 0 | 0 | 0 | 0 | 0 | 0 | 0 | 0 | 0 | 0 | 0 |
| 1996 | 0 | 0 | 0 | 0 | 0 | 0 | 0 | 0 | 0 | 0 | 0 | 0 |
| 1997 | 0 | 0 | 0 | 0 | 0 | 0 | 0 | 0 | 0 | 0 | 0 | 0 |
| 1998 | 0 | 0 | 0 | 0 | 0 | 0 | 0 | 0 | 0 | 0 | 0 | 0 |
| 1999 | 0 | 0 | 0 | 0 | 0 | 0 | 0 | 0 | 0 | 0 | 0 | 0 |
| 2000 | 0 | 0 | 0 | 0 | 0 | 0 | 0 | 0 | 0 | 0 | 0 | 0 |
| 2001 | 3,956 | 247 | 125 | 0 | 0 | 152 | 29 | 0 | 419 | 0 | 0 | 0 |
| 2002 | 0 | 0 | 0 | 0 | 0 | 0 | 0 | 502 | 0 | 0 | 0 | 67 |
| 2003 | 1,022 | 0 | 0 | 0 | 97 | 209 | 0 | 0 | 0 | 0 | 0 | 0 |
| 2004 | 286 | 40 | 754 | 230 | 259 | 181 | 284 | 323 | 378 | 326 | 338 | |
| 2005 | 356 | 285 | 173 | 284 | 445 | 313 | 206 | 310 | 200 | 738 | 250 | |
| 2006 | 210 | 284 | 314 | 124 | 337 | 47 | ||||||
| 2007 | 67 | 22 | ||||||||||
| 2012 | 598 | |||||||||||
| 2013 | 312 | 2 | ||||||||||
| 2014 | 16 | 10 | ||||||||||
| 2017 | 30 | 36 | 309 | |||||||||
| 2018 | 30 | 57 | 38 | 32 | ||||||||
| 2019 | 80 | 155 | 39 | 33 | 492 | 1,028 | 452 | 75 | ||||
| 2020 | 53 | 46 | 313 | 566 | 33 | 309 | 1,402 | 267 | 457 | |||
| 2021 | 814 | 179 | 117 | 836 | 631 | 522 | 542 | 399 | 62 | 290 | 15 | |
| 2022 | 0 | 275 | 94 | 26 | 503 | 43 | 181 | |||||
| 2023 | 127 | 123 | 200 | 1,050 | 30 | 40 | 209 | 465 | ||||
| - = No Data Reported; -- = Not Applicable; NA = Not Available; W = Withheld to avoid disclosure of individual company data. |
| Release Date: 3/29/2024 |
| Next Release Date: 4/30/2024 |