|
Download Data (XLS File) |
|
||||||||
|
||||||||
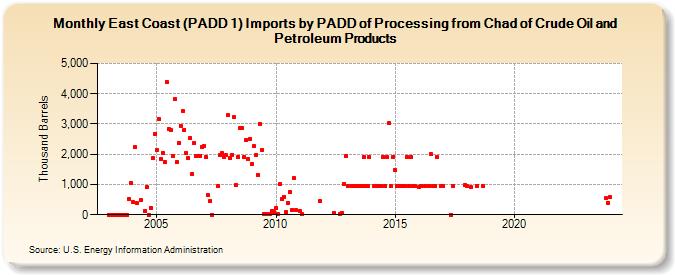
| East Coast (PADD 1) Imports by PADD of Processing from Chad of Crude Oil and Petroleum Products (Thousand Barrels) | ||||||||
| Year | Jan | Feb | Mar | Apr | May | Jun | Jul | Aug | Sep | Oct | Nov | Dec |
|---|---|---|---|---|---|---|---|---|---|---|---|---|
| 2003 | 0 | 0 | 0 | 0 | 0 | 0 | 0 | 0 | 0 | 0 | 523 | 1,054 |
| 2004 | 419 | 2,226 | 395 | 490 | 117 | 908 | 1 | 234 | 1,866 | 2,683 | ||
| 2005 | 2,125 | 3,161 | 1,856 | 2,043 | 1,757 | 4,381 | 2,819 | 2,789 | 1,957 | 3,821 | 1,740 | 2,372 |
| 2006 | 2,948 | 3,429 | 2,816 | 2,037 | 1,872 | 2,542 | 1,354 | 2,375 | 1,934 | 1,955 | 1,951 | 2,228 |
| 2007 | 2,267 | 1,912 | 649 | 451 | 2 | 954 | 1,979 | 2,024 | 1,917 | 1,965 | ||
| 2008 | 3,288 | 1,883 | 1,987 | 3,222 | 986 | 1,920 | 2,855 | 2,865 | 1,910 | 2,466 | 1,839 | 2,513 |
| 2009 | 1,681 | 2,258 | 1,971 | 1,326 | 2,996 | 2,151 | 36 | 23 | 34 | 125 | 86 | |
| 2010 | 232 | 17 | 1,007 | 525 | 595 | 74 | 403 | 753 | 167 | 1,211 | 151 | |
| 2011 | 113 | 15 | 454 | |||||||||
| 2012 | 72 | 39 | 70 | 1,001 | 1,945 | |||||||
| 2013 | 955 | 959 | 953 | 955 | 954 | 951 | 952 | 1,908 | 953 | 933 | 1,904 | |
| 2014 | 951 | 953 | 952 | 952 | 1,901 | 953 | 1,904 | 3,028 | 956 | 1,922 | ||
| 2015 | 1,471 | 956 | 955 | 956 | 954 | 950 | 1,909 | 954 | 1,909 | 954 | 950 | |
| 2016 | 908 | 949 | 955 | 950 | 1,995 | 951 | 949 | 1,901 | 951 | |||
| 2017 | 951 | 6 | 952 | 996 | ||||||||
| 2018 | 951 | 903 | 952 | 950 | ||||||||
| 2023 | 543 | 403 | ||||||||||
| 2024 | 573 | 174 | 189 | |||||||||
| - = No Data Reported; -- = Not Applicable; NA = Not Available; W = Withheld to avoid disclosure of individual company data. |
| Release Date: 8/30/2024 |
| Next Release Date: 9/30/2024 |