|
Download Data (XLS File) |
|
||||||||
|
||||||||
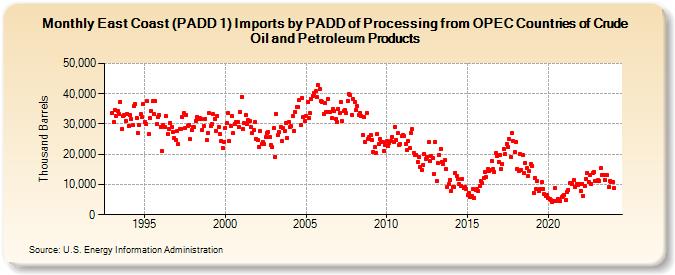
| East Coast (PADD 1) Imports by PADD of Processing from OPEC Countries of Crude Oil and Petroleum Products (Thousand Barrels) | ||||||||
| Year | Jan | Feb | Mar | Apr | May | Jun | Jul | Aug | Sep | Oct | Nov | Dec |
|---|---|---|---|---|---|---|---|---|---|---|---|---|
| 1993 | 33,689 | 30,639 | 34,741 | 32,568 | 34,213 | 33,453 | 37,401 | 28,257 | 32,576 | 32,907 | 31,010 | 33,415 |
| 1994 | 29,429 | 33,048 | 31,648 | 29,555 | 35,803 | 36,668 | 32,057 | 26,948 | 29,535 | 33,158 | 32,240 | 36,754 |
| 1995 | 30,789 | 29,890 | 37,591 | 26,578 | 31,988 | 34,429 | 37,533 | 33,137 | 37,530 | 29,901 | 32,351 | 32,827 |
| 1996 | 29,153 | 20,984 | 29,786 | 28,876 | 32,620 | 26,646 | 28,456 | 30,344 | 29,022 | 27,508 | 25,337 | 24,759 |
| 1997 | 27,587 | 23,225 | 28,328 | 28,426 | 32,221 | 33,493 | 28,623 | 32,937 | 29,358 | 29,765 | 25,012 | 27,979 |
| 1998 | 29,019 | 28,860 | 31,110 | 32,425 | 31,714 | 31,887 | 31,628 | 28,133 | 29,358 | 31,745 | 24,677 | 27,158 |
| 1999 | 33,533 | 29,181 | 30,106 | 33,207 | 31,741 | 27,788 | 32,652 | 29,039 | 26,836 | 24,399 | 22,206 | 24,127 |
| 2000 | 28,776 | 30,186 | 33,539 | 24,285 | 29,369 | 32,614 | 26,886 | 30,138 | 30,660 | 30,681 | 29,097 | 33,845 |
| 2001 | 39,048 | 28,250 | 30,274 | 33,069 | 29,922 | 31,354 | 30,955 | 28,945 | 26,964 | 27,984 | 30,623 | 25,180 |
| 2002 | 24,611 | 22,499 | 27,547 | 23,464 | 24,181 | 23,337 | 25,615 | 26,954 | 27,431 | 25,683 | 22,994 | 22,395 |
| 2003 | 28,700 | 19,110 | 33,261 | 26,295 | 27,274 | 29,050 | 24,278 | 28,573 | 27,529 | 30,394 | 25,374 | 30,617 |
| 2004 | 28,884 | 29,252 | 32,474 | 27,809 | 34,046 | 35,470 | 35,591 | 38,061 | 29,558 | 38,640 | 32,408 | 31,066 |
| 2005 | 32,530 | 37,369 | 32,045 | 33,488 | 38,323 | 39,402 | 40,281 | 40,854 | 38,874 | 42,802 | 41,723 | 37,661 |
| 2006 | 37,398 | 33,351 | 36,771 | 33,864 | 38,098 | 33,853 | 33,983 | 31,875 | 34,795 | 34,176 | 31,486 | 30,607 |
| 2007 | 35,037 | 33,648 | 37,100 | 30,982 | 34,245 | 34,507 | 33,623 | 37,630 | 39,798 | 39,449 | 33,095 | 38,240 |
| 2008 | 37,201 | 34,489 | 35,816 | 32,933 | 33,791 | 32,644 | 26,279 | 32,354 | 24,126 | 33,519 | 25,130 | 25,816 |
| 2009 | 26,412 | 24,629 | 20,872 | 22,259 | 20,483 | 26,632 | 23,456 | 24,969 | 23,896 | 23,904 | 21,199 | 22,894 |
| 2010 | 24,257 | 22,676 | 23,689 | 24,245 | 25,743 | 24,084 | 28,956 | 24,855 | 26,893 | 22,897 | 23,431 | 25,999 |
| 2011 | 26,432 | 26,072 | 23,275 | 21,287 | 24,397 | 22,008 | 27,104 | 28,214 | 20,566 | 19,752 | 19,867 | 17,504 |
| 2012 | 18,960 | 15,620 | 14,648 | 16,548 | 20,145 | 18,509 | 19,151 | 23,943 | 17,655 | 19,256 | 18,747 | 13,513 |
| 2013 | 24,071 | 11,074 | 17,092 | 19,633 | 21,790 | 17,579 | 16,744 | 17,935 | 15,076 | 9,063 | 10,107 | 11,575 |
| 2014 | 7,953 | 9,085 | 9,030 | 13,934 | 12,840 | 11,667 | 10,057 | 9,358 | 11,840 | 8,708 | 9,108 | 8,477 |
| 2015 | 6,356 | 7,328 | 5,717 | 6,276 | 8,368 | 5,674 | 8,253 | 8,338 | 7,680 | 9,641 | 11,059 | 10,466 |
| 2016 | 12,172 | 14,278 | 12,417 | 15,062 | 14,319 | 14,769 | 17,709 | 15,181 | 14,135 | 20,354 | 19,480 | 17,462 |
| 2017 | 19,803 | 15,054 | 16,804 | 21,882 | 20,023 | 23,429 | 22,409 | 24,904 | 19,143 | 27,089 | 24,423 | 20,892 |
| 2018 | 24,146 | 15,169 | 14,570 | 20,036 | 14,932 | 19,829 | 13,754 | 17,046 | 15,321 | 12,955 | 14,327 | 16,774 |
| 2019 | 16,142 | 7,344 | 12,160 | 8,425 | 11,032 | 7,866 | 8,497 | 10,679 | 8,549 | 6,687 | 6,218 | 6,618 |
| 2020 | 5,434 | 5,154 | 4,746 | 4,164 | 4,603 | 8,672 | 4,584 | 5,292 | 4,832 | 4,393 | 5,938 | 6,162 |
| 2021 | 6,489 | 4,731 | 7,582 | 8,314 | 10,333 | 10,632 | 10,266 | 11,355 | 9,176 | 10,288 | 9,664 | 10,065 |
| 2022 | 7,951 | 10,263 | 6,289 | 9,372 | 11,931 | 13,886 | 10,869 | 13,154 | 10,291 | 13,711 | 14,260 | 11,121 |
| 2023 | 11,120 | 11,348 | 11,291 | 15,322 | 13,258 | 13,164 | 11,565 | 13,137 | 13,048 | 9,126 | 11,214 | 10,930 |
| 2024 | 10,965 | |||||||||||
| - = No Data Reported; -- = Not Applicable; NA = Not Available; W = Withheld to avoid disclosure of individual company data. |
| Release Date: 3/29/2024 |
| Next Release Date: 4/30/2024 |