|
Download Data (XLS File) |
|
||||||||
|
||||||||
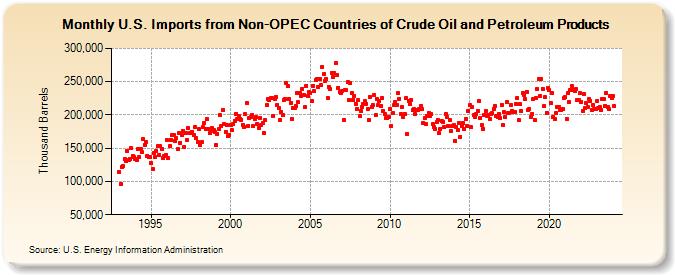
| U.S. Imports from Non-OPEC Countries of Crude Oil and Petroleum Products (Thousand Barrels) | ||||||||
| Year | Jan | Feb | Mar | Apr | May | Jun | Jul | Aug | Sep | Oct | Nov | Dec |
|---|---|---|---|---|---|---|---|---|---|---|---|---|
| 1993 | 114,387 | 96,260 | 122,273 | 122,604 | 133,230 | 131,318 | 145,864 | 131,968 | 134,047 | 149,973 | 138,718 | 136,464 |
| 1994 | 134,308 | 131,734 | 148,304 | 136,822 | 148,941 | 143,616 | 163,465 | 155,225 | 159,222 | 138,989 | 136,087 | 136,755 |
| 1995 | 127,207 | 118,450 | 143,458 | 137,329 | 145,733 | 152,868 | 139,532 | 152,601 | 149,343 | 135,311 | 138,758 | 139,931 |
| 1996 | 162,574 | 135,148 | 152,879 | 162,633 | 169,430 | 169,902 | 161,245 | 164,947 | 148,128 | 172,552 | 158,304 | 170,083 |
| 1997 | 176,229 | 152,059 | 172,183 | 162,775 | 180,332 | 172,120 | 172,949 | 174,767 | 170,318 | 182,254 | 165,506 | 159,953 |
| 1998 | 178,092 | 154,610 | 158,704 | 181,452 | 187,415 | 179,113 | 193,508 | 179,328 | 172,379 | 176,075 | 180,698 | 176,638 |
| 1999 | 173,760 | 155,118 | 172,018 | 178,170 | 199,391 | 183,579 | 207,111 | 186,153 | 174,939 | 184,474 | 168,056 | 170,517 |
| 2000 | 185,092 | 176,769 | 185,915 | 191,611 | 201,858 | 194,215 | 198,716 | 194,321 | 192,908 | 185,478 | 182,188 | 200,827 |
| 2001 | 217,873 | 184,033 | 195,326 | 196,471 | 199,942 | 182,741 | 193,799 | 196,310 | 186,754 | 180,933 | 195,931 | 185,047 |
| 2002 | 187,825 | 172,794 | 192,431 | 214,789 | 223,460 | 221,898 | 224,989 | 224,816 | 198,665 | 223,410 | 227,578 | 214,994 |
| 2003 | 210,820 | 192,342 | 204,960 | 199,503 | 222,188 | 224,244 | 248,009 | 242,905 | 224,206 | 217,948 | 194,246 | 211,046 |
| 2004 | 209,879 | 213,781 | 233,003 | 218,689 | 232,207 | 228,772 | 239,471 | 230,403 | 211,893 | 243,583 | 228,755 | 234,206 |
| 2005 | 232,973 | 220,892 | 243,976 | 235,759 | 252,121 | 254,546 | 242,571 | 253,411 | 244,317 | 272,681 | 261,384 | 251,622 |
| 2006 | 254,212 | 225,772 | 242,291 | 238,488 | 263,357 | 256,863 | 262,703 | 277,989 | 259,452 | 241,151 | 234,694 | 232,507 |
| 2007 | 236,579 | 193,053 | 237,297 | 236,759 | 248,742 | 222,963 | 247,852 | 233,108 | 222,458 | 228,212 | 216,813 | 209,514 |
| 2008 | 221,753 | 197,947 | 206,581 | 212,074 | 216,093 | 220,320 | 216,968 | 208,525 | 193,043 | 227,158 | 212,461 | 214,766 |
| 2009 | 230,568 | 199,832 | 224,280 | 214,746 | 220,246 | 213,344 | 225,552 | 206,242 | 201,102 | 195,195 | 195,596 | 197,264 |
| 2010 | 209,154 | 184,000 | 202,663 | 214,482 | 219,693 | 214,394 | 232,411 | 224,412 | 201,349 | 211,962 | 197,130 | 202,072 |
| 2011 | 224,930 | 172,028 | 220,612 | 215,930 | 222,825 | 207,353 | 209,115 | 201,663 | 206,976 | 207,982 | 208,495 | 213,581 |
| 2012 | 209,273 | 188,524 | 195,420 | 186,252 | 197,994 | 203,072 | 198,610 | 201,337 | 186,104 | 181,675 | 178,595 | 188,723 |
| 2013 | 192,907 | 172,804 | 179,579 | 191,064 | 189,417 | 181,341 | 201,831 | 196,781 | 183,473 | 192,118 | 175,514 | 183,718 |
| 2014 | 184,602 | 161,202 | 181,698 | 176,775 | 188,298 | 167,551 | 182,814 | 187,362 | 178,921 | 193,672 | 182,639 | 205,912 |
| 2015 | 214,628 | 181,388 | 211,371 | 199,209 | 197,454 | 202,076 | 206,476 | 220,360 | 195,110 | 184,205 | 179,452 | 200,534 |
| 2016 | 206,242 | 198,250 | 199,181 | 194,050 | 201,990 | 202,530 | 209,642 | 213,755 | 198,728 | 197,453 | 201,973 | 195,357 |
| 2017 | 215,520 | 184,462 | 204,298 | 197,371 | 218,877 | 202,763 | 203,217 | 215,435 | 206,164 | 204,190 | 204,957 | 216,860 |
| 2018 | 225,399 | 191,681 | 216,300 | 205,553 | 232,364 | 230,559 | 223,877 | 234,886 | 206,796 | 208,901 | 197,075 | 201,647 |
| 2019 | 223,661 | 192,309 | 225,114 | 238,754 | 254,213 | 227,945 | 253,615 | 239,517 | 213,331 | 226,229 | 203,447 | 240,216 |
| 2020 | 237,266 | 217,479 | 233,428 | 197,019 | 193,128 | 202,532 | 211,772 | 212,130 | 206,733 | 207,373 | 209,498 | 225,402 |
| 2021 | 226,783 | 193,882 | 232,453 | 219,795 | 236,921 | 243,971 | 236,873 | 236,599 | 238,407 | 222,010 | 222,867 | 232,229 |
| 2022 | 219,517 | 206,006 | 231,592 | 210,279 | 217,435 | 212,121 | 224,473 | 221,171 | 207,181 | 215,106 | 208,737 | 208,830 |
| 2023 | 221,180 | 210,026 | 211,775 | 207,030 | 224,490 | 223,351 | 213,513 | 232,579 | 212,441 | 208,291 | 228,382 | 225,444 |
| 2024 | 227,757 | |||||||||||
| - = No Data Reported; -- = Not Applicable; NA = Not Available; W = Withheld to avoid disclosure of individual company data. |
| Release Date: 3/29/2024 |
| Next Release Date: 4/30/2024 |