|
Download Data (XLS File) |
|
||||||||
|
||||||||
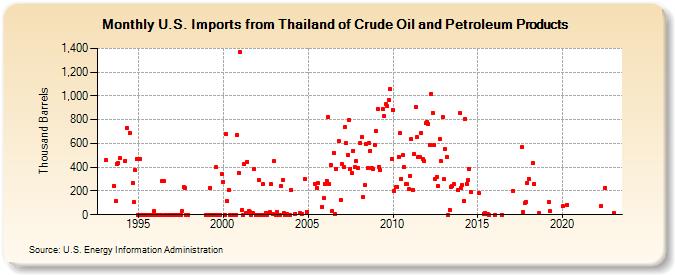
| U.S. Imports from Thailand of Crude Oil and Petroleum Products (Thousand Barrels) | ||||||||
| Year | Jan | Feb | Mar | Apr | May | Jun | Jul | Aug | Sep | Oct | Nov | Dec |
|---|---|---|---|---|---|---|---|---|---|---|---|---|
| 1993 | 458 | 245 | 115 | 423 | 432 | 474 | ||||||
| 1994 | 455 | 734 | 691 | 270 | 108 | 374 | 473 | |||||
| 1995 | 0 | 470 | 0 | 0 | 0 | 0 | 0 | 0 | 0 | 0 | 0 | 28 |
| 1996 | 0 | 0 | 0 | 0 | 0 | 283 | 283 | 0 | 0 | 0 | 0 | 0 |
| 1997 | 0 | 0 | 0 | 0 | 0 | 0 | 0 | 29 | 230 | 229 | 0 | 0 |
| 1999 | 0 | 0 | 0 | 227 | 0 | 0 | 0 | 399 | 0 | 0 | 0 | 343 |
| 2000 | 277 | 0 | 679 | 113 | 209 | 0 | 0 | 0 | 0 | 0 | 673 | 352 |
| 2001 | 1,366 | 39 | 0 | 425 | 13 | 446 | 29 | 21 | 0 | 12 | 381 | 0 |
| 2002 | 0 | 292 | 0 | 0 | 258 | 0 | 16 | 0 | 12 | 20 | 256 | 10 |
| 2003 | 449 | 0 | 24 | 0 | 0 | 240 | 296 | 12 | 0 | 10 | 0 | 0 |
| 2004 | 211 | 9 | 12 | 8 | 301 | 22 | ||||||
| 2005 | 260 | 225 | 263 | 69 | 138 | |||||||
| 2006 | 262 | 284 | 822 | 259 | 422 | 30 | 522 | 5 | 388 | 618 | 125 | |
| 2007 | 427 | 404 | 737 | 600 | 503 | 798 | 389 | 351 | 540 | 398 | 449 | 397 |
| 2008 | 601 | 656 | 147 | 248 | 595 | 391 | 603 | 539 | 396 | 382 | 590 | |
| 2009 | 701 | 891 | 404 | 374 | 887 | 827 | 929 | 911 | 969 | 1,056 | 470 | |
| 2010 | 884 | 198 | 230 | 236 | 486 | 686 | 303 | 499 | 399 | 258 | 259 | 214 |
| 2011 | 328 | 635 | 211 | 514 | 906 | 652 | 482 | 482 | 688 | 465 | 448 | 769 |
| 2012 | 781 | 764 | 591 | 1,019 | 858 | 589 | 301 | 320 | 241 | 636 | 448 | 820 |
| 2013 | 298 | 550 | 484 | 1 | 43 | 237 | 240 | 256 | 208 | 857 | ||
| 2014 | 228 | 250 | 117 | 803 | 259 | 290 | 382 | 190 | ||||
| 2015 | 182 | 9 | 17 | 2 | 2 | 1 | ||||||
| 2016 | 1 | 1 | ||||||||||
| 2017 | 199 | 569 | 21 | 100 | 110 | 269 | ||||||
| 2018 | 303 | 434 | 260 | 11 | ||||||||
| 2019 | 109 | 28 | ||||||||||
| 2020 | 70 | 85 | ||||||||||
| 2022 | 75 | 227 | ||||||||||
| 2023 | 15 | |||||||||||
| - = No Data Reported; -- = Not Applicable; NA = Not Available; W = Withheld to avoid disclosure of individual company data. |
| Release Date: 3/29/2024 |
| Next Release Date: 4/30/2024 |