|
Download Data (XLS File) |
|
||||||||
|
||||||||
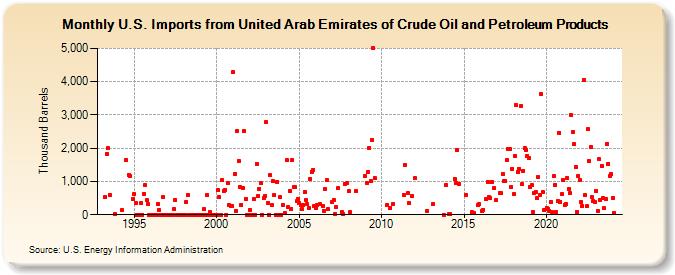
| U.S. Imports from United Arab Emirates of Crude Oil and Petroleum Products (Thousand Barrels) | ||||||||
| Year | Jan | Feb | Mar | Apr | May | Jun | Jul | Aug | Sep | Oct | Nov | Dec |
|---|---|---|---|---|---|---|---|---|---|---|---|---|
| 1993 | 523 | 1,837 | 1,992 | 603 | 20 | |||||||
| 1994 | 131 | 1,645 | 1,203 | 1,166 | 465 | |||||||
| 1995 | 628 | 350 | 0 | 0 | 0 | 348 | 0 | 632 | 882 | 430 | 312 | 0 |
| 1996 | 0 | 0 | 0 | 0 | 0 | 317 | 137 | 0 | 0 | 526 | 0 | 0 |
| 1997 | 0 | 0 | 0 | 0 | 0 | 171 | 445 | 0 | 0 | 0 | 0 | 0 |
| 1998 | 0 | 0 | 396 | 599 | 0 | 0 | 0 | 0 | 0 | 0 | 0 | 0 |
| 1999 | 0 | 0 | 0 | 163 | 0 | 583 | 0 | 96 | 0 | 0 | 0 | 0 |
| 2000 | 0 | 735 | 528 | 0 | 1,039 | 715 | 747 | 0 | 943 | 284 | 275 | 275 |
| 2001 | 4,276 | 1,237 | 125 | 2,520 | 1,619 | 832 | 307 | 795 | 2,521 | 486 | 0 | 0 |
| 2002 | 150 | 0 | 0 | 475 | 0 | 1,526 | 564 | 788 | 941 | 0 | 497 | 566 |
| 2003 | 2,785 | 366 | 0 | 1,184 | 279 | 1,002 | 600 | 0 | 994 | 0 | 521 | 0 |
| 2004 | 286 | 40 | 1,630 | 230 | 716 | 181 | 1,643 | 819 | 838 | 403 | 478 | |
| 2005 | 356 | 285 | 173 | 284 | 681 | 445 | 313 | 206 | 1,079 | 1,294 | 1,356 | 250 |
| 2006 | 210 | 284 | 314 | 250 | 124 | 769 | 1,040 | 157 | ||||
| 2007 | 380 | 446 | 22 | 221 | 794 | 67 | 22 | 925 | 951 | |||
| 2008 | 700 | 74 | 700 | |||||||||
| 2009 | 1,163 | 956 | 1,286 | 2,006 | 1,013 | 2,237 | 4,997 | 1,095 | ||||
| 2010 | 295 | 210 | 314 | |||||||||
| 2011 | 594 | 1,501 | 657 | 339 | 554 | |||||||
| 2012 | 1,094 | 123 | ||||||||||
| 2013 | 312 | 2 | 898 | |||||||||
| 2014 | 16 | 10 | 1,075 | 941 | 1,933 | 937 | ||||||
| 2015 | 602 | 67 | 43 | 284 | 309 | |||||||
| 2016 | 111 | 151 | 464 | 997 | 531 | 501 | 977 | 796 | 428 | |||
| 2017 | 654 | 639 | 1,224 | 1,017 | 1,008 | 1,630 | 1,962 | 1,983 | 848 | 1,387 | ||
| 2018 | 620 | 1,771 | 3,303 | 1,294 | 1,387 | 3,267 | 915 | 1,319 | 1,995 | 1,960 | 1,771 | 1,710 |
| 2019 | 829 | 885 | 88 | 664 | 677 | 492 | 1,131 | 589 | 3,615 | 673 | 141 | |
| 2020 | 216 | 185 | 115 | 397 | 77 | 1,163 | 907 | 89 | 410 | 2,469 | 395 | 614 |
| 2021 | 1,033 | 293 | 325 | 1,109 | 770 | 644 | 2,991 | 2,499 | 2,123 | 1,429 | 95 | 1,169 |
| 2022 | 1,047 | 381 | 263 | 4,044 | 578 | 257 | 2,564 | 1,602 | 2,021 | 521 | 410 | 390 |
| 2023 | 721 | 123 | 1,663 | 442 | 1,478 | 500 | 194 | 470 | 2,139 | 1,533 | 1,172 | 1,222 |
| 2024 | 499 | |||||||||||
| - = No Data Reported; -- = Not Applicable; NA = Not Available; W = Withheld to avoid disclosure of individual company data. |
| Release Date: 3/29/2024 |
| Next Release Date: 4/30/2024 |