|
Download Data (XLS File) |
|
||||||||
|
||||||||
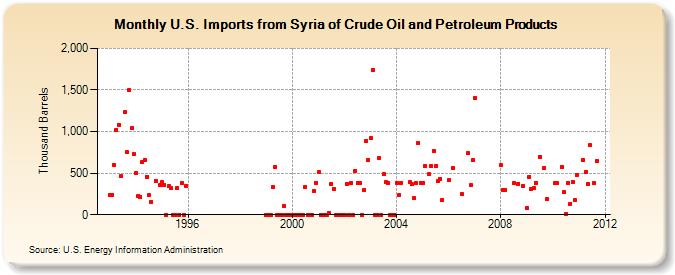
| U.S. Imports from Syria of Crude Oil and Petroleum Products (Thousand Barrels) | ||||||||
| Year | Jan | Feb | Mar | Apr | May | Jun | Jul | Aug | Sep | Oct | Nov | Dec |
|---|---|---|---|---|---|---|---|---|---|---|---|---|
| 1993 | 242 | 236 | 600 | 1,019 | 1,083 | 462 | 1,232 | 750 | 1,499 | 1,042 | 732 | |
| 1994 | 500 | 231 | 217 | 631 | 660 | 459 | 237 | 158 | 402 | 358 | ||
| 1995 | 392 | 361 | 0 | 342 | 323 | 0 | 0 | 316 | 0 | 384 | 0 | 346 |
| 1999 | 0 | 0 | 0 | 330 | 578 | 0 | 0 | 0 | 109 | 0 | 0 | 0 |
| 2000 | 0 | 0 | 0 | 0 | 0 | 0 | 334 | 0 | 0 | 0 | 287 | 387 |
| 2001 | 514 | 0 | 0 | 0 | 0 | 21 | 373 | 315 | 0 | 0 | 0 | 0 |
| 2002 | 0 | 375 | 0 | 387 | 0 | 529 | 379 | 381 | 0 | 298 | 885 | 661 |
| 2003 | 921 | 1,738 | 0 | 0 | 677 | 0 | 486 | 391 | 387 | 0 | 0 | 0 |
| 2004 | 384 | 232 | 386 | 389 | 366 | 199 | 378 | 864 | 386 | |||
| 2005 | 383 | 588 | 485 | 586 | 765 | 582 | 408 | 431 | 182 | |||
| 2006 | 417 | 556 | 247 | 738 | 352 | 655 | ||||||
| 2007 | 1,402 | |||||||||||
| 2008 | 597 | 303 | 295 | 384 | 373 | 351 | ||||||
| 2009 | 81 | 458 | 314 | 319 | 386 | 699 | 561 | 185 | ||||
| 2010 | 380 | 383 | 577 | 275 | 13 | 378 | 133 | 395 | 178 | 476 | ||
| 2011 | 660 | 513 | 372 | 834 | 383 | 641 | ||||||
| - = No Data Reported; -- = Not Applicable; NA = Not Available; W = Withheld to avoid disclosure of individual company data. |
| Release Date: 3/29/2024 |
| Next Release Date: 4/30/2024 |