|
Download Data (XLS File) |
|
||||||||
|
||||||||
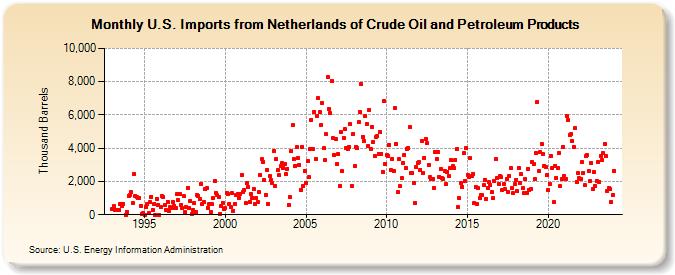
| U.S. Imports from Netherlands of Crude Oil and Petroleum Products (Thousand Barrels) | ||||||||
| Year | Jan | Feb | Mar | Apr | May | Jun | Jul | Aug | Sep | Oct | Nov | Dec |
|---|---|---|---|---|---|---|---|---|---|---|---|---|
| 1993 | 342 | 508 | 313 | 309 | 301 | 662 | 537 | 655 | 7 | 173 | ||
| 1994 | 1,145 | 1,190 | 1,346 | 707 | 2,440 | 1,141 | 1,088 | 1,008 | 1,011 | 543 | 27 | 109 |
| 1995 | 0 | 469 | 657 | 94 | 744 | 1,095 | 283 | 662 | 0 | 972 | 608 | 0 |
| 1996 | 488 | 1,101 | 1,070 | 593 | 288 | 784 | 229 | 438 | 394 | 745 | 542 | 428 |
| 1997 | 1,230 | 910 | 1,241 | 596 | 410 | 1,100 | 163 | 454 | 1,629 | 393 | 836 | 43 |
| 1998 | 299 | 701 | 151 | 1,196 | 1,131 | 944 | 1,833 | 642 | 767 | 1,521 | 1,585 | 427 |
| 1999 | 649 | 185 | 620 | 1,025 | 2,025 | 1,324 | 1,162 | 1,085 | 46 | 514 | 731 | 344 |
| 2000 | 384 | 1,319 | 1,220 | 631 | 488 | 1,304 | 245 | 671 | 1,180 | 1,235 | 1,021 | 1,267 |
| 2001 | 2,398 | 1,339 | 1,488 | 691 | 1,878 | 1,682 | 775 | 1,234 | 1,032 | 1,551 | 647 | 1,014 |
| 2002 | 773 | 1,350 | 2,391 | 3,333 | 3,197 | 2,062 | 1,214 | 2,706 | 619 | 2,323 | 2,100 | 1,893 |
| 2003 | 3,804 | 1,747 | 3,338 | 2,684 | 2,363 | 2,924 | 3,091 | 2,836 | 3,070 | 2,442 | 2,777 | 584 |
| 2004 | 1,050 | 3,812 | 5,365 | 3,337 | 2,944 | 4,055 | 3,407 | 3,007 | 1,514 | 4,093 | 1,739 | 2,632 |
| 2005 | 1,934 | 3,225 | 2,265 | 3,939 | 5,717 | 3,953 | 6,192 | 3,348 | 5,962 | 6,999 | 6,172 | 5,370 |
| 2006 | 6,728 | 3,992 | 3,262 | 4,825 | 8,299 | 6,355 | 6,098 | 8,034 | 4,595 | 3,600 | 4,567 | 3,035 |
| 2007 | 3,660 | 1,751 | 4,948 | 2,618 | 4,639 | 5,134 | 4,031 | 3,924 | 4,081 | 5,445 | 1,752 | 4,874 |
| 2008 | 2,913 | 4,101 | 3,992 | 5,556 | 6,183 | 7,858 | 4,697 | 4,447 | 5,906 | 5,450 | 4,132 | 6,298 |
| 2009 | 3,945 | 5,286 | 4,383 | 3,514 | 4,648 | 4,721 | 3,648 | 4,948 | 3,671 | 2,596 | 6,823 | 3,068 |
| 2010 | 3,589 | 3,534 | 4,211 | 2,666 | 3,340 | 2,608 | 6,423 | 4,259 | 1,364 | 3,337 | 1,703 | 2,207 |
| 2011 | 3,122 | 3,602 | 2,836 | 3,981 | 3,992 | 5,262 | 2,478 | 2,504 | 1,916 | 716 | 2,867 | 3,116 |
| 2012 | 3,140 | 2,711 | 4,439 | 2,523 | 3,433 | 4,531 | 4,287 | 3,007 | 2,242 | 2,146 | 2,167 | 1,625 |
| 2013 | 3,744 | 3,374 | 3,796 | 2,283 | 2,740 | 2,213 | 2,135 | 2,626 | 1,819 | 2,587 | 2,343 | 2,782 |
| 2014 | 3,272 | 2,929 | 2,805 | 3,293 | 3,927 | 439 | 989 | 1,899 | 1,685 | 3,693 | 2,048 | 3,999 |
| 2015 | 2,404 | 2,254 | 3,404 | 2,328 | 2,466 | 695 | 1,662 | 673 | 1,580 | 998 | 1,180 | 1,170 |
| 2016 | 1,771 | 2,110 | 934 | 1,634 | 1,950 | 1,780 | 1,340 | 976 | 1,997 | 3,327 | 2,226 | 1,848 |
| 2017 | 2,339 | 2,251 | 1,493 | 1,859 | 1,526 | 2,159 | 1,380 | 2,300 | 2,798 | 1,589 | 1,288 | 1,819 |
| 2018 | 2,113 | 1,407 | 2,831 | 1,923 | 2,430 | 1,593 | 1,334 | 2,122 | 1,328 | 2,747 | 1,462 | 1,521 |
| 2019 | 3,184 | 3,028 | 2,123 | 3,706 | 6,770 | 2,644 | 3,753 | 4,279 | 3,638 | 2,937 | 2,888 | 2,361 |
| 2020 | 1,494 | 1,870 | 3,522 | 2,799 | 751 | 2,948 | 2,234 | 2,828 | 3,739 | 1,726 | 2,163 | 4,082 |
| 2021 | 2,334 | 2,147 | 5,941 | 5,666 | 4,785 | 4,844 | 4,433 | 4,088 | 5,222 | 1,993 | 2,489 | 2,189 |
| 2022 | 2,154 | 3,171 | 2,511 | 1,765 | 3,509 | 3,567 | 2,622 | 2,000 | 3,119 | 1,553 | 2,564 | 1,742 |
| 2023 | 2,048 | 3,182 | 1,968 | 3,521 | 3,315 | 3,686 | 4,261 | 3,524 | 1,438 | 1,585 | 1,535 | 778 |
| 2024 | 1,197 | |||||||||||
| - = No Data Reported; -- = Not Applicable; NA = Not Available; W = Withheld to avoid disclosure of individual company data. |
| Release Date: 3/29/2024 |
| Next Release Date: 4/30/2024 |