|
Download Data (XLS File) |
|
||||||||
|
||||||||
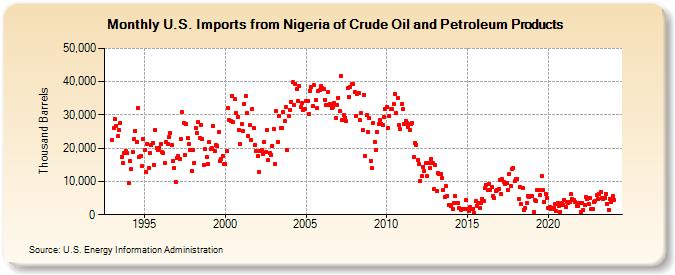
| U.S. Imports from Nigeria of Crude Oil and Petroleum Products (Thousand Barrels) | ||||||||
| Year | Jan | Feb | Mar | Apr | May | Jun | Jul | Aug | Sep | Oct | Nov | Dec |
|---|---|---|---|---|---|---|---|---|---|---|---|---|
| 1993 | 22,595 | 25,957 | 28,771 | 26,764 | 23,551 | 25,451 | 27,677 | 17,420 | 15,429 | 18,687 | 19,077 | 18,540 |
| 1994 | 9,618 | 16,135 | 13,665 | 18,929 | 22,682 | 25,268 | 21,791 | 32,143 | 17,332 | 17,624 | 14,544 | 22,909 |
| 1995 | 19,381 | 12,966 | 21,283 | 13,999 | 18,692 | 20,887 | 21,573 | 14,953 | 25,543 | 20,119 | 19,389 | 20,199 |
| 1996 | 21,400 | 18,764 | 18,407 | 15,547 | 21,852 | 21,318 | 23,235 | 24,589 | 20,817 | 16,149 | 13,956 | 9,923 |
| 1997 | 16,987 | 17,507 | 16,806 | 22,690 | 30,753 | 27,578 | 17,975 | 27,347 | 23,062 | 21,319 | 19,457 | 13,110 |
| 1998 | 19,526 | 15,682 | 26,209 | 24,669 | 27,856 | 23,126 | 27,051 | 22,807 | 15,050 | 19,638 | 17,231 | 15,202 |
| 1999 | 21,774 | 19,627 | 20,148 | 26,710 | 19,120 | 21,101 | 20,653 | 24,786 | 16,035 | 16,840 | 17,645 | 15,204 |
| 2000 | 15,192 | 19,044 | 32,189 | 28,452 | 28,298 | 35,666 | 27,732 | 34,772 | 30,591 | 29,338 | 25,541 | 21,264 |
| 2001 | 27,313 | 25,045 | 33,359 | 35,750 | 30,616 | 23,780 | 26,937 | 22,536 | 31,712 | 26,092 | 20,884 | 19,019 |
| 2002 | 17,503 | 12,692 | 19,254 | 19,364 | 18,319 | 21,828 | 18,829 | 25,407 | 16,412 | 18,509 | 17,867 | 20,767 |
| 2003 | 25,762 | 15,322 | 31,075 | 22,004 | 29,699 | 25,984 | 26,121 | 30,835 | 28,081 | 32,510 | 19,394 | 29,735 |
| 2004 | 31,333 | 33,820 | 39,793 | 33,019 | 39,366 | 37,808 | 34,148 | 38,804 | 32,288 | 33,437 | 31,508 | 31,828 |
| 2005 | 34,200 | 34,175 | 30,196 | 37,295 | 38,245 | 32,659 | 38,897 | 34,469 | 31,942 | 37,280 | 37,447 | 38,635 |
| 2006 | 38,042 | 37,744 | 34,594 | 32,948 | 36,880 | 32,852 | 33,258 | 32,091 | 32,328 | 33,725 | 29,099 | 33,101 |
| 2007 | 35,221 | 31,048 | 41,767 | 28,438 | 29,897 | 29,029 | 28,071 | 37,954 | 35,439 | 38,468 | 39,184 | 39,416 |
| 2008 | 36,909 | 29,711 | 36,381 | 36,636 | 28,446 | 30,493 | 25,470 | 36,137 | 17,722 | 29,847 | 24,796 | 29,111 |
| 2009 | 16,239 | 13,897 | 27,610 | 21,998 | 19,404 | 24,892 | 27,250 | 28,442 | 27,353 | 26,927 | 29,394 | 31,904 |
| 2010 | 32,478 | 26,107 | 29,823 | 31,814 | 31,803 | 33,225 | 36,409 | 30,524 | 35,221 | 27,023 | 25,685 | 33,185 |
| 2011 | 31,695 | 27,374 | 28,307 | 27,669 | 26,486 | 25,597 | 27,418 | 27,642 | 17,386 | 21,497 | 21,101 | 16,560 |
| 2012 | 15,311 | 10,243 | 11,582 | 14,489 | 13,272 | 15,452 | 11,521 | 15,628 | 14,032 | 16,843 | 15,489 | 7,696 |
| 2013 | 14,835 | 7,138 | 12,483 | 12,161 | 12,250 | 10,985 | 7,447 | 5,190 | 8,591 | 5,664 | 2,801 | 3,066 |
| 2014 | 2,757 | 1,649 | 3,482 | 5,605 | 3,652 | 3,451 | 1,902 | 1,486 | 1,717 | 1,829 | 1,651 | 4,469 |
| 2015 | 1,581 | 1,052 | 2,425 | 1,607 | 1,785 | 627 | 4,032 | 2,668 | 3,428 | 2,026 | 3,405 | 4,820 |
| 2016 | 4,077 | 7,947 | 9,000 | 7,298 | 9,198 | 7,566 | 8,210 | 5,620 | 5,045 | 7,201 | 7,395 | 7,616 |
| 2017 | 10,293 | 6,238 | 10,594 | 9,946 | 9,108 | 9,601 | 7,472 | 12,295 | 8,759 | 13,666 | 14,093 | 10,003 |
| 2018 | 10,831 | 10,794 | 4,738 | 8,246 | 3,173 | 8,013 | 1,344 | 2,054 | 3,375 | 5,642 | 5,392 | 5,484 |
| 2019 | 5,618 | 931 | 4,388 | 4,111 | 7,518 | 7,544 | 5,989 | 11,779 | 7,346 | 3,959 | 6,330 | 5,056 |
| 2020 | 1,978 | 2,218 | 1,676 | 1,707 | 2,127 | 3,096 | 1,066 | 3,543 | 2,729 | 925 | 3,570 | 2,890 |
| 2021 | 4,502 | 2,193 | 3,828 | 3,568 | 3,823 | 6,091 | 4,660 | 4,342 | 3,966 | 2,691 | 2,613 | 3,422 |
| 2022 | 884 | 3,562 | 1,515 | 2,840 | 5,227 | 4,674 | 3,184 | 5,043 | 1,824 | 1,601 | 3,917 | 4,148 |
| 2023 | 6,009 | 4,699 | 6,369 | 6,956 | 4,977 | 4,628 | 5,086 | 6,267 | 3,354 | 1,498 | 4,812 | 3,695 |
| 2024 | 5,536 | |||||||||||
| - = No Data Reported; -- = Not Applicable; NA = Not Available; W = Withheld to avoid disclosure of individual company data. |
| Release Date: 3/29/2024 |
| Next Release Date: 4/30/2024 |