|
Download Data (XLS File) |
|
||||||||
|
||||||||
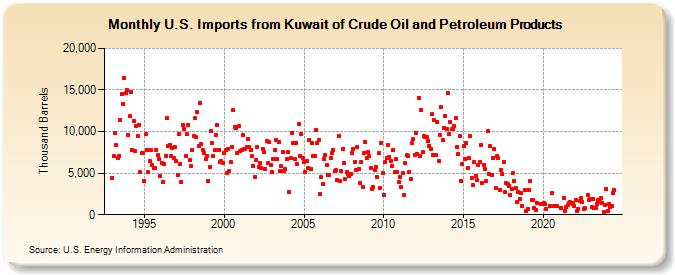
| U.S. Imports from Kuwait of Crude Oil and Petroleum Products (Thousand Barrels) | ||||||||
| Year | Jan | Feb | Mar | Apr | May | Jun | Jul | Aug | Sep | Oct | Nov | Dec |
|---|---|---|---|---|---|---|---|---|---|---|---|---|
| 1993 | 4,459 | 7,027 | 9,807 | 8,359 | 6,875 | 7,037 | 11,416 | 14,483 | 13,348 | 16,423 | 14,585 | 15,004 |
| 1994 | 9,591 | 11,838 | 14,767 | 7,821 | 11,236 | 7,655 | 10,695 | 9,482 | 10,839 | 5,127 | 7,479 | 7,434 |
| 1995 | 4,023 | 9,674 | 7,817 | 5,134 | 6,457 | 7,798 | 6,030 | 5,575 | 5,614 | 7,750 | 7,126 | 6,670 |
| 1996 | 4,599 | 6,252 | 3,952 | 6,040 | 7,118 | 11,643 | 8,259 | 8,394 | 7,077 | 8,073 | 6,843 | 8,121 |
| 1997 | 6,475 | 4,804 | 9,755 | 6,134 | 3,978 | 10,817 | 10,259 | 7,101 | 9,649 | 10,825 | 6,606 | 5,826 |
| 1998 | 7,822 | 9,466 | 11,600 | 9,324 | 12,365 | 8,257 | 13,493 | 8,461 | 7,772 | 7,478 | 6,724 | 7,082 |
| 1999 | 4,085 | 5,750 | 10,033 | 8,578 | 7,046 | 7,761 | 9,643 | 10,776 | 7,830 | 6,357 | 6,483 | 6,212 |
| 2000 | 7,413 | 7,755 | 5,030 | 7,933 | 5,280 | 6,293 | 8,176 | 12,542 | 10,550 | 10,432 | 7,448 | 10,662 |
| 2001 | 7,645 | 7,840 | 9,539 | 7,893 | 7,943 | 8,101 | 9,058 | 8,094 | 7,781 | 7,006 | 5,868 | 4,505 |
| 2002 | 6,589 | 8,132 | 5,708 | 6,245 | 5,653 | 7,947 | 7,554 | 5,516 | 8,918 | 6,176 | 8,741 | 5,998 |
| 2003 | 5,152 | 6,757 | 7,790 | 9,022 | 6,741 | 8,762 | 5,249 | 5,856 | 7,503 | 5,204 | 5,454 | 6,718 |
| 2004 | 7,572 | 2,681 | 6,810 | 9,835 | 8,622 | 6,722 | 8,597 | 6,119 | 10,936 | 7,110 | 9,734 | 6,802 |
| 2005 | 6,308 | 5,129 | 6,418 | 5,609 | 9,029 | 5,509 | 8,610 | 7,087 | 7,118 | 10,245 | 8,656 | 9,011 |
| 2006 | 2,433 | 4,476 | 3,654 | 6,742 | 7,168 | 6,024 | 4,805 | 4,805 | 6,824 | 7,413 | 7,763 | 5,248 |
| 2007 | 5,340 | 4,191 | 9,462 | 4,056 | 5,197 | 7,890 | 6,267 | 4,324 | 5,089 | 4,860 | 4,608 | 4,901 |
| 2008 | 7,397 | 7,887 | 6,298 | 5,429 | 8,166 | 5,476 | 3,776 | 6,280 | 3,295 | 7,440 | 8,766 | 6,776 |
| 2009 | 7,514 | 7,018 | 5,606 | 3,141 | 3,297 | 5,366 | 5,785 | 4,589 | 7,369 | 3,214 | 8,614 | 4,964 |
| 2010 | 2,383 | 6,389 | 6,762 | 8,353 | 6,966 | 6,505 | 5,849 | 7,769 | 5,165 | 6,669 | 5,086 | 3,886 |
| 2011 | 4,558 | 3,312 | 4,990 | 2,338 | 6,199 | 7,138 | 7,054 | 5,130 | 4,336 | 8,616 | 9,062 | 7,157 |
| 2012 | 9,882 | 7,299 | 14,087 | 7,060 | 12,617 | 7,502 | 9,432 | 9,336 | 9,296 | 8,910 | 8,286 | 7,879 |
| 2013 | 12,070 | 7,150 | 11,381 | 7,150 | 11,181 | 6,518 | 9,585 | 13,006 | 8,980 | 10,382 | 11,908 | 10,297 |
| 2014 | 14,688 | 9,737 | 11,154 | 10,267 | 10,344 | 10,650 | 11,629 | 8,164 | 7,353 | 9,427 | 4,098 | 6,109 |
| 2015 | 8,251 | 6,738 | 8,585 | 5,574 | 6,872 | 9,411 | 4,456 | 3,515 | 6,337 | 4,664 | 4,193 | 5,972 |
| 2016 | 6,369 | 8,389 | 3,812 | 5,971 | 5,478 | 4,052 | 10,025 | 4,843 | 8,251 | 4,767 | 6,847 | 7,883 |
| 2017 | 3,265 | 7,017 | 6,788 | 3,030 | 5,390 | 4,851 | 6,380 | 2,690 | 3,824 | 3,686 | 3,499 | 2,418 |
| 2018 | 3,100 | 4,968 | 4,051 | 3,201 | 1,516 | 2,761 | 1,938 | 2,565 | 1,086 | 3,027 | 502 | |
| 2019 | 664 | 2,959 | 4,012 | 1,816 | 1,753 | 770 | 614 | 1,424 | 1,232 | 1,339 | ||
| 2020 | 1,437 | 1,337 | 712 | 1,012 | 2,609 | 1,060 | 1,068 | 1,026 | ||||
| 2021 | 806 | 1,984 | 425 | 959 | 1,159 | 1,421 | 1,519 | 1,449 | 1,299 | 1,055 | ||
| 2022 | 1,783 | 392 | 677 | 1,610 | 2,012 | 1,500 | 721 | 773 | 2,374 | 1,765 | 1,886 | |
| 2023 | 948 | 1,870 | 776 | 777 | 1,244 | 1,792 | 1,486 | 2,014 | 1,411 | 295 | 1,119 | 3,097 |
| 2024 | 503 | |||||||||||
| - = No Data Reported; -- = Not Applicable; NA = Not Available; W = Withheld to avoid disclosure of individual company data. |
| Release Date: 3/29/2024 |
| Next Release Date: 4/30/2024 |