|
Download Data (XLS File) |
|
||||||||
|
||||||||
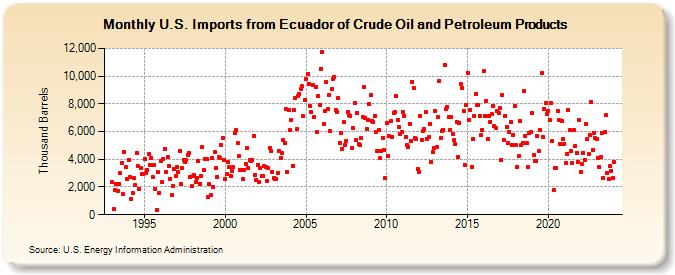
| U.S. Imports from Ecuador of Crude Oil and Petroleum Products (Thousand Barrels) | ||||||||
| Year | Jan | Feb | Mar | Apr | May | Jun | Jul | Aug | Sep | Oct | Nov | Dec |
|---|---|---|---|---|---|---|---|---|---|---|---|---|
| 1993 | 2,353 | 394 | 1,814 | 2,223 | 1,723 | 2,239 | 2,981 | 3,764 | 1,468 | 4,538 | 3,441 | 2,596 |
| 1994 | 3,956 | 2,697 | 1,150 | 1,551 | 2,644 | 2,158 | 4,475 | 3,550 | 1,877 | 3,402 | 2,907 | 2,966 |
| 1995 | 4,029 | 2,983 | 3,212 | 4,385 | 3,611 | 4,110 | 2,686 | 3,610 | 1,844 | 360 | 3,050 | 1,591 |
| 1996 | 3,902 | 2,362 | 4,055 | 4,731 | 3,112 | 4,151 | 3,504 | 2,560 | 1,443 | 2,058 | 3,323 | 2,759 |
| 1997 | 3,474 | 3,079 | 4,586 | 2,202 | 3,370 | 3,947 | 3,776 | 3,959 | 4,276 | 4,423 | 2,737 | 2,050 |
| 1998 | 2,761 | 2,879 | 2,331 | 2,626 | 3,863 | 2,243 | 2,761 | 4,887 | 3,208 | 4,038 | 4,016 | 1,269 |
| 1999 | 2,180 | 1,430 | 4,067 | 2,010 | 4,502 | 3,345 | 2,718 | 4,132 | 4,093 | 5,039 | 5,546 | 3,957 |
| 2000 | 2,585 | 2,954 | 3,777 | 3,416 | 2,811 | 3,170 | 3,471 | 5,886 | 6,139 | 5,161 | 4,234 | 3,217 |
| 2001 | 3,198 | 2,573 | 3,208 | 3,684 | 4,793 | 3,338 | 3,921 | 3,893 | 3,975 | 5,715 | 2,895 | 2,483 |
| 2002 | 3,597 | 2,352 | 3,397 | 2,782 | 2,813 | 3,514 | 3,416 | 2,448 | 3,406 | 4,838 | 4,585 | 3,114 |
| 2003 | 2,633 | 2,593 | 2,554 | 3,032 | 4,607 | 4,078 | 4,457 | 5,357 | 5,185 | 7,609 | 3,098 | 7,549 |
| 2004 | 6,098 | 6,829 | 3,516 | 7,575 | 8,405 | 6,164 | 8,597 | 8,734 | 9,068 | 9,274 | 7,111 | 8,269 |
| 2005 | 9,775 | 10,153 | 9,464 | 7,828 | 7,379 | 9,354 | 7,058 | 9,218 | 5,932 | 8,532 | 7,916 | 10,544 |
| 2006 | 11,772 | 6,565 | 7,490 | 9,611 | 7,618 | 8,643 | 6,021 | 9,038 | 9,768 | 9,968 | 7,530 | 7,433 |
| 2007 | 8,436 | 5,182 | 5,914 | 4,766 | 6,686 | 5,051 | 5,333 | 7,440 | 7,181 | 7,144 | 4,817 | 6,229 |
| 2008 | 8,052 | 5,389 | 7,374 | 5,095 | 5,009 | 5,506 | 7,025 | 9,225 | 6,994 | 6,197 | 6,856 | 7,992 |
| 2009 | 8,607 | 6,790 | 6,673 | 7,122 | 5,994 | 4,612 | 6,146 | 4,057 | 4,590 | 5,565 | 4,652 | 2,663 |
| 2010 | 6,650 | 4,259 | 5,660 | 6,738 | 5,639 | 7,358 | 7,406 | 8,557 | 6,868 | 6,302 | 5,822 | 5,965 |
| 2011 | 7,392 | 7,149 | 5,642 | 5,059 | 4,907 | 6,570 | 5,343 | 9,587 | 9,155 | 5,533 | 5,441 | 3,294 |
| 2012 | 3,087 | 7,090 | 5,400 | 6,032 | 6,155 | 7,431 | 5,458 | 5,588 | 6,545 | 3,788 | 4,529 | 4,810 |
| 2013 | 7,455 | 4,860 | 7,072 | 9,650 | 5,533 | 6,071 | 6,140 | 10,833 | 7,662 | 7,794 | 7,064 | 6,144 |
| 2014 | 7,029 | 5,808 | 5,365 | 5,096 | 6,716 | 4,139 | 6,647 | 9,444 | 9,159 | 7,507 | 3,609 | 7,894 |
| 2015 | 10,248 | 6,858 | 7,568 | 3,428 | 5,447 | 7,117 | 8,705 | 7,923 | 7,925 | 7,139 | 5,721 | 6,097 |
| 2016 | 10,350 | 7,133 | 8,188 | 5,466 | 7,133 | 6,702 | 7,245 | 7,854 | 6,379 | 6,284 | 7,500 | 7,331 |
| 2017 | 7,671 | 3,958 | 8,627 | 5,396 | 7,125 | 6,356 | 5,141 | 5,973 | 6,683 | 5,065 | 5,780 | 7,852 |
| 2018 | 5,004 | 3,452 | 4,209 | 6,737 | 5,007 | 5,177 | 8,913 | 5,687 | 5,148 | 3,443 | 5,866 | 5,954 |
| 2019 | 7,370 | 4,312 | 3,853 | 3,850 | 5,669 | 4,622 | 6,141 | 10,204 | 5,595 | 7,661 | 8,056 | 7,279 |
| 2020 | 7,496 | 6,836 | 8,052 | 5,291 | 1,806 | 3,354 | 3,355 | 7,516 | 6,817 | 5,129 | 6,797 | 5,450 |
| 2021 | 5,088 | 3,743 | 4,409 | 7,524 | 6,091 | 4,577 | 3,708 | 6,127 | 4,952 | 4,472 | 3,810 | 6,802 |
| 2022 | 3,097 | 3,639 | 4,476 | 3,952 | 6,576 | 5,473 | 4,376 | 5,754 | 8,150 | 4,688 | 5,918 | 5,518 |
| 2023 | 5,467 | 4,080 | 3,441 | 4,189 | 5,908 | 2,651 | 5,951 | 7,174 | 3,008 | 2,585 | 3,503 | 3,181 |
| 2024 | 2,684 | |||||||||||
| - = No Data Reported; -- = Not Applicable; NA = Not Available; W = Withheld to avoid disclosure of individual company data. |
| Release Date: 3/29/2024 |
| Next Release Date: 4/30/2024 |