|
Download Data (XLS File) |
|
||||||||
|
||||||||
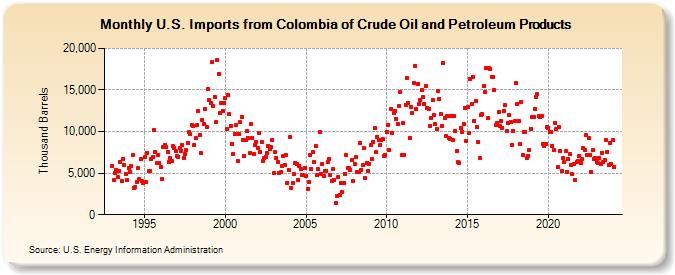
| U.S. Imports from Colombia of Crude Oil and Petroleum Products (Thousand Barrels) | ||||||||
| Year | Jan | Feb | Mar | Apr | May | Jun | Jul | Aug | Sep | Oct | Nov | Dec |
|---|---|---|---|---|---|---|---|---|---|---|---|---|
| 1993 | 5,835 | 4,140 | 4,986 | 5,349 | 4,564 | 5,268 | 6,323 | 4,047 | 6,726 | 5,959 | 4,918 | 4,162 |
| 1994 | 5,640 | 5,160 | 5,821 | 7,229 | 3,269 | 3,348 | 3,936 | 5,613 | 4,307 | 6,656 | 4,022 | 3,857 |
| 1995 | 6,907 | 3,901 | 7,422 | 5,256 | 5,310 | 6,758 | 6,920 | 10,243 | 7,571 | 6,164 | 7,187 | 6,190 |
| 1996 | 5,766 | 4,311 | 8,119 | 8,389 | 8,142 | 7,512 | 6,311 | 6,839 | 6,404 | 8,216 | 8,021 | 7,627 |
| 1997 | 7,044 | 6,956 | 8,047 | 7,639 | 8,418 | 6,826 | 7,288 | 7,762 | 8,672 | 9,944 | 9,647 | 10,835 |
| 1998 | 10,694 | 8,435 | 9,186 | 10,741 | 12,425 | 9,622 | 7,392 | 11,364 | 10,895 | 12,755 | 10,571 | 15,123 |
| 1999 | 13,805 | 13,433 | 18,349 | 13,061 | 14,200 | 11,106 | 18,600 | 16,960 | 12,184 | 13,381 | 12,489 | 13,414 |
| 2000 | 14,009 | 10,307 | 14,370 | 12,067 | 10,715 | 8,484 | 7,335 | 9,688 | 10,804 | 6,431 | 9,724 | 11,115 |
| 2001 | 11,734 | 8,985 | 7,065 | 9,028 | 10,019 | 9,252 | 7,409 | 10,862 | 9,209 | 7,244 | 8,331 | 8,758 |
| 2002 | 8,061 | 9,859 | 7,492 | 8,721 | 6,507 | 6,855 | 6,947 | 7,424 | 8,246 | 7,890 | 8,097 | 8,959 |
| 2003 | 4,958 | 7,535 | 6,825 | 6,358 | 5,018 | 5,101 | 5,822 | 7,014 | 5,994 | 7,160 | 3,868 | 5,420 |
| 2004 | 9,290 | 3,199 | 3,851 | 4,905 | 6,267 | 6,071 | 4,221 | 5,912 | 5,483 | 4,824 | 4,774 | 5,616 |
| 2005 | 4,663 | 3,071 | 3,914 | 7,239 | 5,471 | 7,543 | 6,354 | 8,255 | 4,748 | 5,446 | 9,893 | 4,935 |
| 2006 | 6,046 | 4,698 | 5,275 | 5,273 | 6,317 | 6,697 | 4,833 | 4,053 | 5,537 | 4,115 | 1,380 | 2,308 |
| 2007 | 4,585 | 2,387 | 3,754 | 2,705 | 3,778 | 4,926 | 7,175 | 5,604 | 5,567 | 5,414 | 6,573 | 4,019 |
| 2008 | 6,139 | 6,970 | 5,111 | 5,104 | 8,620 | 5,407 | 5,944 | 7,969 | 4,455 | 6,193 | 5,266 | 6,134 |
| 2009 | 8,348 | 6,755 | 8,777 | 10,422 | 7,524 | 9,399 | 8,958 | 8,341 | 9,025 | 9,065 | 7,104 | 7,149 |
| 2010 | 9,989 | 10,813 | 7,794 | 12,685 | 9,766 | 12,201 | 12,525 | 11,527 | 10,892 | 13,089 | 14,770 | 7,151 |
| 2011 | 11,003 | 7,219 | 13,236 | 16,440 | 13,437 | 9,273 | 12,955 | 12,235 | 15,874 | 17,918 | 12,726 | 15,744 |
| 2012 | 13,350 | 13,742 | 14,950 | 14,163 | 13,322 | 15,449 | 12,795 | 12,667 | 10,708 | 11,652 | 13,779 | 12,009 |
| 2013 | 10,883 | 10,258 | 14,852 | 13,940 | 12,051 | 10,670 | 18,221 | 11,629 | 9,421 | 11,911 | 9,243 | 9,079 |
| 2014 | 11,812 | 8,964 | 11,841 | 10,007 | 7,656 | 6,293 | 6,276 | 10,403 | 10,000 | 10,962 | 12,818 | 8,908 |
| 2015 | 12,932 | 9,885 | 16,277 | 13,254 | 16,599 | 11,314 | 13,662 | 10,521 | 8,748 | 6,852 | 12,047 | 12,102 |
| 2016 | 15,474 | 14,696 | 17,632 | 11,592 | 17,667 | 17,492 | 16,615 | 16,559 | 14,994 | 10,741 | 11,053 | 12,296 |
| 2017 | 10,697 | 11,238 | 10,467 | 12,500 | 13,135 | 10,009 | 11,052 | 12,026 | 11,206 | 8,383 | 10,117 | 11,258 |
| 2018 | 15,857 | 13,349 | 11,284 | 8,450 | 13,552 | 7,190 | 9,891 | 9,895 | 6,856 | 7,095 | 7,769 | 10,337 |
| 2019 | 11,773 | 11,767 | 12,769 | 14,166 | 14,506 | 11,843 | 11,739 | 11,890 | 8,491 | 8,249 | 8,533 | 10,534 |
| 2020 | 10,456 | 9,949 | 9,994 | 8,312 | 7,761 | 11,079 | 10,275 | 5,767 | 10,538 | 7,696 | 5,242 | 6,796 |
| 2021 | 6,356 | 7,616 | 5,169 | 6,689 | 7,293 | 5,918 | 4,872 | 6,137 | 4,218 | 6,354 | 6,500 | 7,063 |
| 2022 | 6,200 | 6,706 | 7,964 | 7,838 | 9,550 | 7,199 | 9,251 | 7,217 | 5,176 | 7,801 | 6,692 | 6,764 |
| 2023 | 6,315 | 6,171 | 6,791 | 6,108 | 7,460 | 6,397 | 6,634 | 9,028 | 7,600 | 5,989 | 8,671 | 6,070 |
| 2024 | 8,951 | |||||||||||
| - = No Data Reported; -- = Not Applicable; NA = Not Available; W = Withheld to avoid disclosure of individual company data. |
| Release Date: 3/29/2024 |
| Next Release Date: 4/30/2024 |