|
Download Data (XLS File) |
|
||||||||
|
||||||||
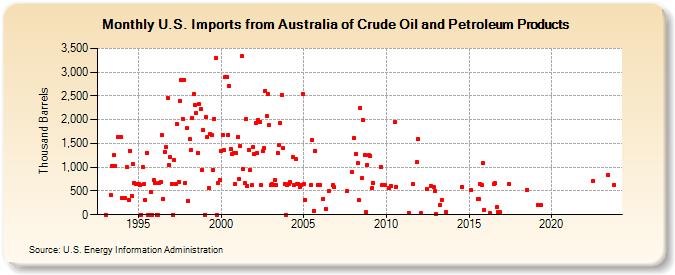
| U.S. Imports from Australia of Crude Oil and Petroleum Products (Thousand Barrels) | ||||||||
| Year | Jan | Feb | Mar | Apr | May | Jun | Jul | Aug | Sep | Oct | Nov | Dec |
|---|---|---|---|---|---|---|---|---|---|---|---|---|
| 1993 | 1 | 407 | 1,031 | 1,253 | 1,022 | 1,640 | 1,639 | |||||
| 1994 | 362 | 343 | 995 | 320 | 1,350 | 401 | 1,063 | 668 | 652 | |||
| 1995 | 652 | 627 | 0 | 996 | 649 | 301 | 1,306 | 0 | 0 | 470 | 1 | 727 |
| 1996 | 661 | 0 | 0 | 672 | 689 | 1,676 | 337 | 1,330 | 1,416 | 2,457 | 1,044 | 1,218 |
| 1997 | 654 | 0 | 1,147 | 646 | 1,906 | 678 | 2,393 | 2,834 | 2,024 | 2,843 | 675 | 1,821 |
| 1998 | 295 | 1,585 | 1,355 | 2,033 | 2,545 | 2,312 | 2,135 | 1,304 | 2,320 | 2,216 | 937 | 1,778 |
| 1999 | 0 | 2,050 | 1,634 | 564 | 1,703 | 1,676 | 944 | 2,019 | 3,300 | 0 | 669 | 728 |
| 2000 | 1,343 | 1,687 | 1,356 | 2,907 | 2,908 | 1,680 | 2,705 | 1,380 | 1,269 | 1,300 | 649 | 1,301 |
| 2001 | 1,645 | 755 | 1,449 | 3,330 | 953 | 657 | 2,004 | 611 | 1,369 | 931 | 618 | 1,428 |
| 2002 | 1,272 | 1,927 | 1,300 | 1,986 | 1,957 | 618 | 1,334 | 1,395 | 2,606 | 2,071 | 2,534 | 1,890 |
| 2003 | 620 | 651 | 631 | 731 | 616 | 1,308 | 1,464 | 1,926 | 2,529 | 1,394 | 653 | 0 |
| 2004 | 623 | 653 | 680 | 1,205 | 631 | 1,173 | 655 | 650 | 589 | 622 | 2,548 | |
| 2005 | 650 | 314 | 621 | 1,580 | 84 | 1,344 | 620 | |||||
| 2006 | 622 | 338 | 115 | 502 | 622 | 575 | ||||||
| 2007 | 497 | 892 | ||||||||||
| 2008 | 1,614 | 1,281 | 1,081 | 300 | 2,255 | 763 | 1,984 | 1,248 | 50 | 1,054 | 1,250 | |
| 2009 | 1,232 | 552 | 667 | 1,002 | 628 | 618 | ||||||
| 2010 | 571 | 606 | 1,942 | 587 | ||||||||
| 2011 | 43 | 638 | 1,103 | 1,592 | ||||||||
| 2012 | 28 | 540 | 603 | 573 | 494 | |||||||
| 2013 | 17 | 210 | 313 | 66 | ||||||||
| 2014 | 578 | |||||||||||
| 2015 | 525 | 326 | 326 | 650 | 620 | 1,087 | 101 | |||||
| 2016 | 30 | 656 | 657 | 160 | 59 | 58 | ||||||
| 2017 | 648 | |||||||||||
| 2018 | 529 | |||||||||||
| 2019 | 202 | 196 | ||||||||||
| 2022 | 700 | |||||||||||
| 2023 | 831 | 633 | ||||||||||
| - = No Data Reported; -- = Not Applicable; NA = Not Available; W = Withheld to avoid disclosure of individual company data. |
| Release Date: 3/29/2024 |
| Next Release Date: 4/30/2024 |