|
Download Data (XLS File) |
|
||||||||
|
||||||||
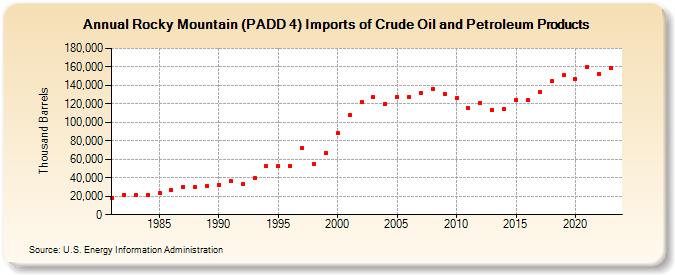
| Rocky Mountain (PADD 4) Imports of Crude Oil and Petroleum Products (Thousand Barrels) | ||||||||
| Decade | Year-0 | Year-1 | Year-2 | Year-3 | Year-4 | Year-5 | Year-6 | Year-7 | Year-8 | Year-9 |
|---|---|---|---|---|---|---|---|---|---|---|
| 1980's | 18,390 | 21,766 | 21,544 | 21,089 | 23,246 | 27,279 | 30,364 | 30,261 | 30,861 | |
| 1990's | 32,599 | 36,252 | 33,358 | 39,411 | 52,458 | 52,564 | 52,957 | 72,228 | 55,322 | 67,253 |
| 2000's | 88,042 | 107,936 | 122,062 | 126,963 | 120,306 | 127,438 | 127,924 | 132,255 | 136,325 | 130,211 |
| 2010's | 125,928 | 115,277 | 121,366 | 113,211 | 114,732 | 124,407 | 124,126 | 132,670 | 144,648 | 150,740 |
| 2020's | 147,025 | 160,198 | 152,312 | 159,076 |
| - = No Data Reported; -- = Not Applicable; NA = Not Available; W = Withheld to avoid disclosure of individual company data. |
| Release Date: 3/29/2024 |
| Next Release Date: 8/30/2024 |