|
Download Data (XLS File) |
|
||||||||
|
||||||||
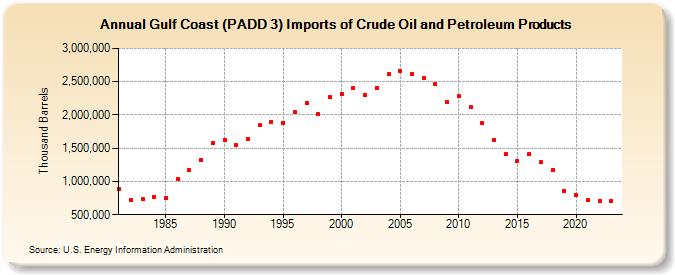
| Gulf Coast (PADD 3) Imports of Crude Oil and Petroleum Products (Thousand Barrels) | ||||||||
| Decade | Year-0 | Year-1 | Year-2 | Year-3 | Year-4 | Year-5 | Year-6 | Year-7 | Year-8 | Year-9 |
|---|---|---|---|---|---|---|---|---|---|---|
| 1980's | 887,084 | 727,438 | 730,059 | 768,846 | 752,415 | 1,039,097 | 1,168,682 | 1,326,563 | 1,573,591 | |
| 1990's | 1,628,859 | 1,549,228 | 1,644,129 | 1,848,038 | 1,898,783 | 1,884,533 | 2,043,442 | 2,183,393 | 2,008,656 | 2,267,196 |
| 2000's | 2,318,404 | 2,402,633 | 2,295,032 | 2,401,337 | 2,611,124 | 2,662,623 | 2,616,114 | 2,556,559 | 2,460,375 | 2,200,292 |
| 2010's | 2,279,979 | 2,119,031 | 1,875,331 | 1,624,289 | 1,410,678 | 1,308,359 | 1,410,223 | 1,286,069 | 1,168,349 | 856,759 |
| 2020's | 792,490 | 714,417 | 704,518 | 702,307 |
| - = No Data Reported; -- = Not Applicable; NA = Not Available; W = Withheld to avoid disclosure of individual company data. |
| Release Date: 4/30/2024 |
| Next Release Date: 8/30/2024 |