|
Download Data (XLS File) |
|
||||||||
|
||||||||
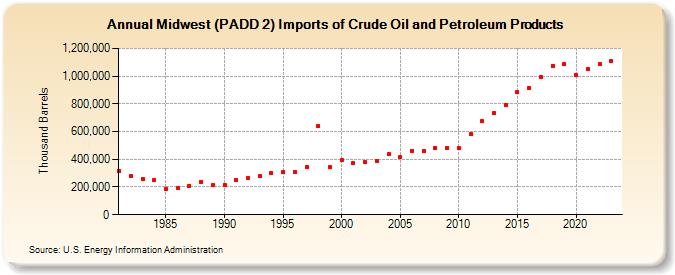
| Midwest (PADD 2) Imports of Crude Oil and Petroleum Products (Thousand Barrels) | ||||||||
| Decade | Year-0 | Year-1 | Year-2 | Year-3 | Year-4 | Year-5 | Year-6 | Year-7 | Year-8 | Year-9 |
|---|---|---|---|---|---|---|---|---|---|---|
| 1980's | 318,344 | 280,046 | 259,628 | 247,484 | 189,078 | 193,903 | 209,347 | 238,236 | 214,364 | |
| 1990's | 216,362 | 253,647 | 267,065 | 277,727 | 300,358 | 307,699 | 309,509 | 347,426 | 641,627 | 342,424 |
| 2000's | 392,635 | 372,685 | 377,248 | 388,922 | 436,101 | 416,788 | 462,748 | 457,592 | 481,345 | 482,028 |
| 2010's | 479,540 | 581,827 | 673,109 | 731,231 | 794,768 | 886,866 | 915,884 | 994,611 | 1,074,808 | 1,084,650 |
| 2020's | 1,005,931 | 1,050,611 | 1,086,340 | 1,107,448 |
| - = No Data Reported; -- = Not Applicable; NA = Not Available; W = Withheld to avoid disclosure of individual company data. |
| Release Date: 3/29/2024 |
| Next Release Date: 8/30/2024 |