|
Download Data (XLS File) |
|
||||||||
|
||||||||
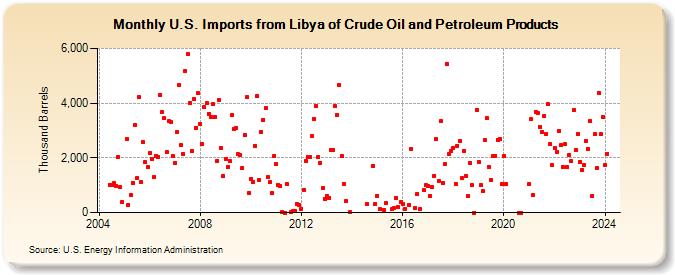
| U.S. Imports from Libya of Crude Oil and Petroleum Products (Thousand Barrels) | ||||||||
| Year | Jan | Feb | Mar | Apr | May | Jun | Jul | Aug | Sep | Oct | Nov | Dec |
|---|---|---|---|---|---|---|---|---|---|---|---|---|
| 2004 | 1,024 | 999 | 1,064 | 988 | 2,045 | 916 | 374 | |||||
| 2005 | 2,691 | 292 | 643 | 1,081 | 3,186 | 1,246 | 4,225 | 1,106 | 2,567 | 1,831 | 1,652 | |
| 2006 | 2,174 | 1,962 | 1,308 | 2,073 | 2,043 | 4,306 | 3,674 | 3,438 | 2,196 | 3,331 | 3,308 | 2,083 |
| 2007 | 1,815 | 2,934 | 4,649 | 2,453 | 2,142 | 5,168 | 5,785 | 4,004 | 2,232 | 4,159 | 3,104 | 4,356 |
| 2008 | 3,250 | 2,511 | 3,844 | 3,989 | 3,605 | 3,505 | 3,962 | 3,492 | 1,888 | 4,107 | 2,361 | 1,320 |
| 2009 | 1,972 | 1,676 | 1,893 | 3,548 | 3,070 | 3,082 | 2,126 | 2,099 | 1,631 | 2,832 | 4,209 | 725 |
| 2010 | 1,237 | 1,130 | 2,449 | 4,257 | 1,208 | 2,951 | 3,401 | 3,811 | 1,293 | 1,101 | 697 | 2,060 |
| 2011 | 1,767 | 1,015 | 977 | 18 | 2 | 1,035 | 20 | 59 | 59 | 303 | 287 | |
| 2012 | 146 | 840 | 1,868 | 2,041 | 2,023 | 2,795 | 3,425 | 3,893 | 2,016 | 1,814 | 909 | 511 |
| 2013 | 606 | 549 | 2,297 | 2,293 | 3,879 | 3,581 | 4,657 | 2,067 | 1,058 | 410 | 10 | |
| 2014 | 308 | 1,718 | 326 | |||||||||
| 2015 | 610 | 120 | 100 | 357 | 117 | 159 | 528 | 189 | 385 | |||
| 2016 | 310 | 143 | 292 | 2,323 | 168 | 670 | 124 | 809 | 989 | |||
| 2017 | 976 | 616 | 922 | 1,347 | 2,686 | 1,151 | 3,337 | 1,093 | 1,765 | 5,447 | 2,150 | 2,251 |
| 2018 | 2,348 | 1,059 | 2,444 | 2,623 | 1,250 | 2,251 | 1,353 | 599 | 1,827 | 1,002 | 2 | 3,758 |
| 2019 | 1,850 | 1,000 | 785 | 2,637 | 3,446 | 1,649 | 1,207 | 2,053 | 2,072 | 2,669 | 2,685 | 1,039 |
| 2020 | 2,074 | 1,041 | 2 | 1 | ||||||||
| 2021 | 1,036 | 3,405 | 643 | 3,693 | 3,649 | 3,142 | 2,950 | 3,529 | 2,888 | 3,955 | 2,497 | 1,720 |
| 2022 | 2,361 | 2,215 | 2,992 | 2,452 | 1,671 | 2,494 | 1,662 | 2,117 | 1,874 | 3,741 | 2,285 | 2,888 |
| 2023 | 1,860 | 1,571 | 1,740 | 2,623 | 2,337 | 3,352 | 609 | 2,854 | 1,644 | 4,384 | 2,854 | 3,499 |
| 2024 | 1,736 | |||||||||||
| - = No Data Reported; -- = Not Applicable; NA = Not Available; W = Withheld to avoid disclosure of individual company data. |
| Release Date: 3/29/2024 |
| Next Release Date: 4/30/2024 |