|
Download Data (XLS File) |
|
||||||||
|
||||||||
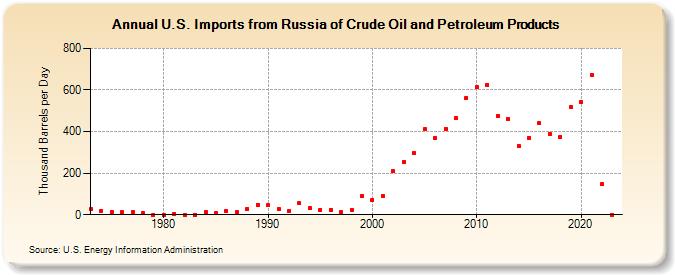
| U.S. Imports from Russia of Crude Oil and Petroleum Products (Thousand Barrels per Day) | ||||||||
| Decade | Year-0 | Year-1 | Year-2 | Year-3 | Year-4 | Year-5 | Year-6 | Year-7 | Year-8 | Year-9 |
|---|---|---|---|---|---|---|---|---|---|---|
| 1970's | 26 | 20 | 14 | 11 | 12 | 8 | 1 | |||
| 1980's | 1 | 5 | 1 | 1 | 13 | 8 | 18 | 11 | 29 | 48 |
| 1990's | 45 | 29 | 18 | 55 | 30 | 25 | 25 | 13 | 24 | 89 |
| 2000's | 72 | 90 | 210 | 254 | 298 | 410 | 369 | 414 | 465 | 563 |
| 2010's | 612 | 624 | 477 | 460 | 330 | 371 | 441 | 389 | 375 | 520 |
| 2020's | 540 | 673 | 147 | 0 |
| - = No Data Reported; -- = Not Applicable; NA = Not Available; W = Withheld to avoid disclosure of individual company data. |
| Release Date: 3/29/2024 |
| Next Release Date: 8/30/2024 |