|
Download Data (XLS File) |
|
||||||||
|
||||||||
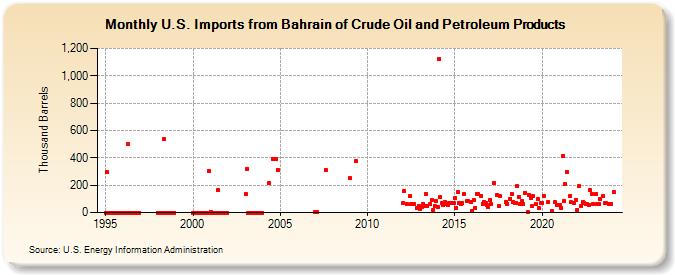
| U.S. Imports from Bahrain of Crude Oil and Petroleum Products (Thousand Barrels) | ||||||||
| Year | Jan | Feb | Mar | Apr | May | Jun | Jul | Aug | Sep | Oct | Nov | Dec |
|---|---|---|---|---|---|---|---|---|---|---|---|---|
| 1995 | 0 | 295 | 0 | 0 | 0 | 0 | 0 | 0 | 0 | 0 | 0 | 0 |
| 1996 | 0 | 0 | 0 | 499 | 0 | 0 | 0 | 0 | 0 | 0 | 0 | 0 |
| 1998 | 0 | 0 | 0 | 0 | 538 | 0 | 0 | 0 | 0 | 0 | 0 | 0 |
| 2000 | 0 | 0 | 0 | 0 | 0 | 0 | 0 | 0 | 0 | 0 | 0 | 303 |
| 2001 | 6 | 0 | 0 | 0 | 0 | 165 | 0 | 0 | 0 | 0 | 0 | 0 |
| 2003 | 136 | 321 | 0 | 0 | 0 | 0 | 0 | 0 | 0 | 0 | 0 | 0 |
| 2004 | 213 | 394 | 392 | 313 | ||||||||
| 2007 | 1 | 4 | 312 | |||||||||
| 2009 | 249 | 374 | ||||||||||
| 2012 | 67 | 155 | 62 | 120 | 60 | 60 | 30 | 49 | ||||
| 2013 | 23 | 39 | 63 | 45 | 135 | 49 | 64 | 92 | 19 | 45 | 85 | |
| 2014 | 38 | 1,121 | 114 | 68 | 53 | 75 | 59 | 56 | 68 | 67 | 68 | 68 |
| 2015 | 107 | 30 | 152 | 68 | 61 | 68 | 137 | 82 | 84 | 77 | ||
| 2016 | 15 | 95 | 34 | 138 | 135 | 124 | 63 | 80 | 69 | 54 | 43 | |
| 2017 | 93 | 62 | 218 | 127 | 45 | 120 | 80 | |||||
| 2018 | 62 | 102 | 138 | 78 | 72 | 70 | 191 | 116 | 61 | 85 | 62 | |
| 2019 | 143 | 4 | 132 | 108 | 47 | 118 | 60 | 98 | 32 | 68 | ||
| 2020 | 73 | 124 | 79 | 11 | 75 | 53 | ||||||
| 2021 | 56 | 30 | 414 | 85 | 207 | 298 | 120 | 75 | 72 | 94 | ||
| 2022 | 19 | 192 | 51 | 78 | 71 | 64 | 64 | 55 | 163 | 138 | 65 | |
| 2023 | 139 | 63 | 65 | 97 | 120 | 69 | 69 | 61 | 62 | |||
| - = No Data Reported; -- = Not Applicable; NA = Not Available; W = Withheld to avoid disclosure of individual company data. |
| Release Date: 3/29/2024 |
| Next Release Date: 4/30/2024 |