|
Download Data (XLS File) |
|
||||||||
|
||||||||
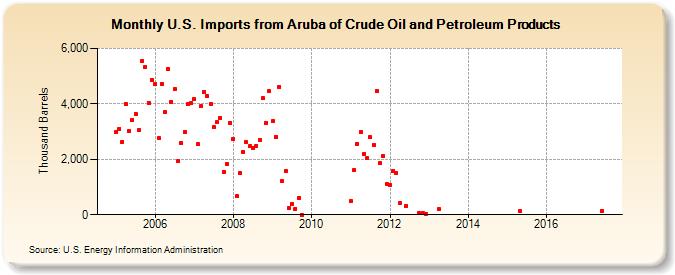
| U.S. Imports from Aruba of Crude Oil and Petroleum Products (Thousand Barrels) | ||||||||
| Year | Jan | Feb | Mar | Apr | May | Jun | Jul | Aug | Sep | Oct | Nov | Dec |
|---|---|---|---|---|---|---|---|---|---|---|---|---|
| 2005 | 2,985 | 3,108 | 2,625 | 3,998 | 3,034 | 3,423 | 3,647 | 3,043 | 5,541 | 5,339 | 4,039 | 4,866 |
| 2006 | 4,715 | 2,767 | 4,724 | 3,699 | 5,252 | 4,078 | 4,533 | 1,926 | 2,601 | 2,978 | 3,986 | 4,031 |
| 2007 | 4,159 | 2,539 | 3,906 | 4,419 | 4,285 | 4,011 | 3,159 | 3,333 | 3,506 | 1,551 | 1,832 | 3,322 |
| 2008 | 2,725 | 671 | 1,487 | 2,265 | 2,612 | 2,462 | 2,404 | 2,496 | 2,685 | 4,194 | 3,317 | 4,449 |
| 2009 | 3,376 | 2,820 | 4,617 | 1,206 | 1,585 | 257 | 375 | 222 | 596 | 3 | ||
| 2011 | 490 | 1,614 | 2,569 | 2,981 | 2,194 | 2,036 | 2,786 | 2,513 | 4,458 | 1,859 | 2,115 | 1,099 |
| 2012 | 1,087 | 1,587 | 1,508 | 412 | 318 | 59 | 57 | 35 | ||||
| 2013 | 206 | |||||||||||
| 2015 | 123 | |||||||||||
| 2017 | 151 | |||||||||||
| - = No Data Reported; -- = Not Applicable; NA = Not Available; W = Withheld to avoid disclosure of individual company data. |
| Release Date: 8/30/2024 |
| Next Release Date: 9/30/2024 |