|
Download Data (XLS File) |
|
||||||||
|
||||||||
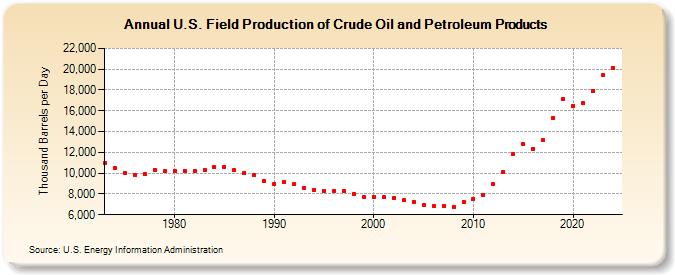
| U.S. Field Production of Crude Oil and Petroleum Products (Thousand Barrels per Day) | ||||||||
| Decade | Year-0 | Year-1 | Year-2 | Year-3 | Year-4 | Year-5 | Year-6 | Year-7 | Year-8 | Year-9 |
|---|---|---|---|---|---|---|---|---|---|---|
| 1970's | 10,975 | 10,498 | 10,045 | 9,774 | 9,913 | 10,328 | 10,179 | |||
| 1980's | 10,214 | 10,230 | 10,252 | 10,299 | 10,554 | 10,636 | 10,289 | 10,008 | 9,818 | 9,219 |
| 1990's | 8,994 | 9,168 | 8,996 | 8,583 | 8,389 | 8,322 | 8,295 | 8,269 | 8,011 | 7,731 |
| 2000's | 7,733 | 7,669 | 7,624 | 7,368 | 7,250 | 6,901 | 6,825 | 6,857 | 6,783 | 7,267 |
| 2010's | 7,558 | 7,890 | 8,932 | 10,101 | 11,796 | 12,774 | 12,359 | 13,142 | 15,329 | 17,138 |
| 2020's | 16,497 | 16,733 | 17,925 | 19,433 |
| - = No Data Reported; -- = Not Applicable; NA = Not Available; W = Withheld to avoid disclosure of individual company data. |
| Release Date: 8/30/2024 |
| Next Release Date: 8/29/2025 |