|
Download Data (XLS File) |
|
||||||||
|
||||||||
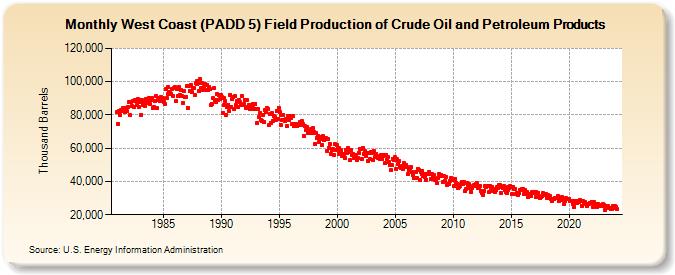
| West Coast (PADD 5) Field Production of Crude Oil and Petroleum Products (Thousand Barrels) | ||||||||
| Year | Jan | Feb | Mar | Apr | May | Jun | Jul | Aug | Sep | Oct | Nov | Dec |
|---|---|---|---|---|---|---|---|---|---|---|---|---|
| 1981 | 81,966 | 74,555 | 82,557 | 79,868 | 82,919 | 82,320 | 84,211 | 83,982 | 81,827 | 84,321 | 82,161 | 85,040 |
| 1982 | 87,790 | 79,926 | 87,849 | 85,249 | 88,467 | 84,825 | 88,892 | 88,648 | 86,240 | 89,477 | 84,984 | 87,587 |
| 1983 | 89,057 | 80,221 | 88,727 | 86,238 | 87,751 | 85,586 | 89,339 | 88,605 | 87,439 | 89,982 | 86,477 | 88,830 |
| 1984 | 90,160 | 84,440 | 84,630 | 88,193 | 91,343 | 84,258 | 88,905 | 90,317 | 88,338 | 90,953 | 89,443 | 89,902 |
| 1985 | 87,923 | 86,714 | 95,549 | 89,997 | 96,613 | 92,827 | 93,591 | 93,472 | 92,856 | 95,811 | 91,431 | 96,065 |
| 1986 | 96,518 | 88,242 | 95,563 | 91,317 | 96,615 | 92,082 | 95,073 | 91,135 | 87,194 | 94,628 | 90,554 | 91,062 |
| 1987 | 97,365 | 84,365 | 97,205 | 94,445 | 98,082 | 93,722 | 96,340 | 96,380 | 92,076 | 99,050 | 98,715 | 100,679 |
| 1988 | 99,009 | 94,183 | 101,408 | 96,021 | 99,102 | 94,717 | 96,997 | 98,450 | 95,249 | 98,161 | 94,801 | 96,487 |
| 1989 | 95,291 | 86,038 | 86,643 | 89,941 | 96,009 | 89,026 | 87,723 | 92,280 | 89,048 | 91,828 | 89,423 | 92,080 |
| 1990 | 90,876 | 81,430 | 89,896 | 86,135 | 88,233 | 79,975 | 85,039 | 86,155 | 82,472 | 92,240 | 84,772 | 89,639 |
| 1991 | 90,658 | 83,743 | 91,214 | 86,178 | 88,364 | 85,058 | 88,852 | 87,497 | 86,078 | 91,474 | 86,099 | 86,852 |
| 1992 | 89,125 | 84,213 | 88,816 | 85,060 | 85,966 | 83,510 | 85,778 | 84,620 | 83,877 | 86,844 | 83,601 | 86,760 |
| 1993 | 83,404 | 75,001 | 83,447 | 78,678 | 81,239 | 76,739 | 76,641 | 80,114 | 75,784 | 82,790 | 81,989 | 84,284 |
| 1994 | 83,425 | 73,646 | 80,362 | 75,220 | 80,897 | 76,518 | 79,076 | 78,891 | 77,185 | 82,575 | 77,557 | 84,241 |
| 1995 | 81,839 | 74,156 | 80,218 | 77,148 | 80,053 | 76,765 | 76,108 | 77,811 | 73,246 | 79,345 | 76,906 | 79,190 |
| 1996 | 78,003 | 74,609 | 79,109 | 73,090 | 74,337 | 74,706 | 73,292 | 73,684 | 73,921 | 75,667 | 74,097 | 76,144 |
| 1997 | 74,268 | 67,380 | 73,180 | 70,738 | 72,567 | 69,126 | 70,446 | 69,286 | 69,500 | 71,506 | 68,864 | 71,919 |
| 1998 | 70,005 | 62,450 | 68,839 | 65,934 | 67,504 | 64,016 | 66,476 | 65,751 | 61,997 | 67,155 | 64,921 | 66,295 |
| 1999 | 66,189 | 58,017 | 65,344 | 60,018 | 62,724 | 56,674 | 59,163 | 59,364 | 55,971 | 62,442 | 58,923 | 61,744 |
| 2000 | 60,254 | 56,638 | 60,157 | 58,096 | 58,797 | 55,302 | 56,686 | 56,521 | 54,110 | 58,657 | 57,295 | 59,858 |
| 2001 | 57,782 | 52,706 | 59,128 | 56,036 | 56,746 | 54,196 | 55,558 | 55,979 | 53,016 | 54,238 | 57,274 | 59,686 |
| 2002 | 59,360 | 53,692 | 60,040 | 56,561 | 58,180 | 56,509 | 55,341 | 56,815 | 52,335 | 57,217 | 53,432 | 57,947 |
| 2003 | 57,323 | 52,603 | 58,083 | 54,518 | 56,774 | 55,008 | 54,336 | 54,823 | 53,660 | 55,660 | 53,789 | 55,251 |
| 2004 | 55,751 | 50,975 | 55,807 | 53,247 | 54,677 | 51,688 | 49,844 | 46,630 | 49,915 | 53,731 | 52,820 | 54,450 |
| 2005 | 52,930 | 47,732 | 53,261 | 50,523 | 52,382 | 48,637 | 48,241 | 49,583 | 47,600 | 50,793 | 49,287 | 49,812 |
| 2006 | 48,642 | 44,532 | 46,721 | 46,863 | 48,499 | 45,903 | 43,807 | 41,893 | 41,897 | 45,575 | 41,964 | 47,691 |
| 2007 | 47,089 | 41,076 | 45,958 | 44,504 | 46,572 | 43,239 | 44,692 | 42,394 | 40,785 | 44,404 | 44,341 | 45,386 |
| 2008 | 44,288 | 41,501 | 44,618 | 42,611 | 43,584 | 40,932 | 41,648 | 39,048 | 42,187 | 44,726 | 43,694 | 44,084 |
| 2009 | 43,234 | 39,828 | 43,403 | 40,284 | 42,909 | 37,985 | 38,437 | 38,456 | 40,407 | 41,839 | 40,849 | 41,570 |
| 2010 | 41,067 | 37,035 | 41,561 | 39,154 | 38,678 | 36,067 | 36,956 | 37,022 | 38,333 | 39,698 | 38,235 | 39,475 |
| 2011 | 34,056 | 35,433 | 39,301 | 38,101 | 38,480 | 36,275 | 33,831 | 36,214 | 37,134 | 37,736 | 37,539 | 38,765 |
| 2012 | 38,837 | 35,915 | 36,813 | 35,922 | 37,219 | 34,491 | 33,011 | 32,007 | 34,523 | 37,493 | 36,539 | 37,364 |
| 2013 | 37,363 | 33,659 | 37,376 | 35,771 | 36,534 | 34,206 | 35,533 | 33,650 | 35,150 | 36,473 | 36,203 | 37,579 |
| 2014 | 37,602 | 33,137 | 36,774 | 36,306 | 37,189 | 34,683 | 33,510 | 32,985 | 34,905 | 36,885 | 36,054 | 37,293 |
| 2015 | 36,876 | 32,746 | 36,771 | 35,645 | 35,565 | 32,433 | 33,356 | 31,805 | 33,004 | 34,924 | 34,783 | 35,557 |
| 2016 | 35,432 | 32,648 | 34,871 | 32,343 | 33,867 | 30,866 | 31,556 | 32,290 | 31,055 | 33,445 | 32,921 | 33,733 |
| 2017 | 33,771 | 30,759 | 33,924 | 32,835 | 33,238 | 30,461 | 29,766 | 30,720 | 31,042 | 32,877 | 31,919 | 32,560 |
| 2018 | 32,347 | 29,781 | 31,780 | 31,008 | 31,078 | 29,699 | 28,028 | 29,670 | 29,695 | 30,149 | 30,333 | 30,131 |
| 2019 | 31,204 | 28,065 | 30,120 | 29,628 | 30,429 | 28,834 | 29,176 | 26,671 | 28,088 | 29,877 | 29,269 | 29,681 |
| 2020 | 29,569 | 28,066 | 28,305 | 28,131 | 26,271 | 24,795 | 28,015 | 27,486 | 27,061 | 28,083 | 27,737 | 28,601 |
| 2021 | 28,175 | 25,449 | 28,059 | 26,840 | 27,573 | 26,594 | 25,263 | 26,495 | 26,447 | 27,093 | 27,079 | 27,878 |
| 2022 | 27,245 | 24,890 | 27,352 | 26,638 | 26,661 | 24,721 | 26,527 | 25,164 | 25,436 | 26,044 | 25,519 | 26,352 |
| 2023 | 25,978 | 23,102 | 25,275 | 24,543 | 25,293 | 24,141 | 23,899 | 23,623 | 23,528 | 24,981 | 24,193 | 25,237 |
| 2024 | 24,915 | |||||||||||
| - = No Data Reported; -- = Not Applicable; NA = Not Available; W = Withheld to avoid disclosure of individual company data. |
| Release Date: 3/29/2024 |
| Next Release Date: 4/30/2024 |