|
Download Data (XLS File) |
|
||||||||
|
||||||||
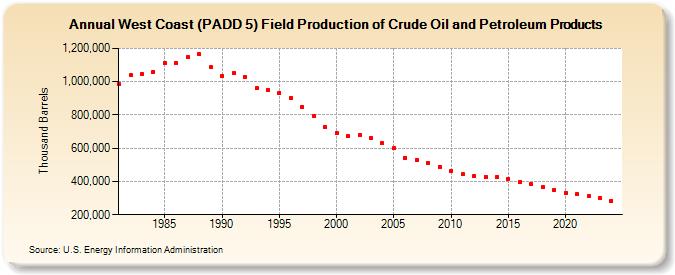
| West Coast (PADD 5) Field Production of Crude Oil and Petroleum Products (Thousand Barrels) | ||||||||
| Decade | Year-0 | Year-1 | Year-2 | Year-3 | Year-4 | Year-5 | Year-6 | Year-7 | Year-8 | Year-9 |
|---|---|---|---|---|---|---|---|---|---|---|
| 1980's | 985,728 | 1,039,934 | 1,048,252 | 1,060,882 | 1,112,849 | 1,109,983 | 1,148,424 | 1,164,585 | 1,085,330 | |
| 1990's | 1,036,862 | 1,052,068 | 1,028,171 | 960,110 | 949,593 | 932,784 | 900,659 | 848,780 | 791,343 | 726,573 |
| 2000's | 692,371 | 672,345 | 677,429 | 661,827 | 629,534 | 600,781 | 543,989 | 530,440 | 512,922 | 489,202 |
| 2010's | 463,282 | 442,864 | 430,134 | 429,497 | 427,323 | 413,468 | 395,027 | 383,873 | 363,698 | 351,042 |
| 2020's | 332,121 | 322,944 | 310,806 | 300,191 |
| - = No Data Reported; -- = Not Applicable; NA = Not Available; W = Withheld to avoid disclosure of individual company data. |
| Release Date: 8/30/2024 |
| Next Release Date: 8/29/2025 |