|
Download Data (XLS File) |
|
||||||||
|
||||||||
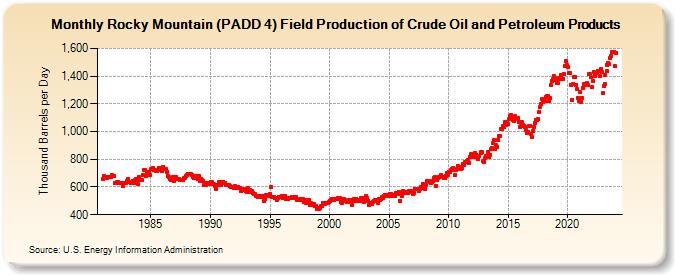
| Rocky Mountain (PADD 4) Field Production of Crude Oil and Petroleum Products (Thousand Barrels per Day) | ||||||||
| Year | Jan | Feb | Mar | Apr | May | Jun | Jul | Aug | Sep | Oct | Nov | Dec |
|---|---|---|---|---|---|---|---|---|---|---|---|---|
| 1981 | 658 | 677 | 671 | 671 | 666 | 672 | 669 | 671 | 672 | 684 | 680 | 677 |
| 1982 | 629 | 631 | 635 | 635 | 628 | 631 | 626 | 626 | 606 | 627 | 629 | 628 |
| 1983 | 644 | 661 | 637 | 638 | 632 | 639 | 644 | 630 | 650 | 661 | 650 | 619 |
| 1984 | 669 | 651 | 650 | 649 | 689 | 724 | 724 | 676 | 708 | 710 | 708 | 687 |
| 1985 | 727 | 733 | 739 | 724 | 726 | 713 | 714 | 721 | 738 | 734 | 723 | 712 |
| 1986 | 746 | 730 | 733 | 727 | 710 | 679 | 670 | 658 | 652 | 663 | 670 | 646 |
| 1987 | 674 | 671 | 655 | 661 | 657 | 651 | 649 | 649 | 649 | 664 | 665 | 677 |
| 1988 | 685 | 696 | 691 | 697 | 695 | 687 | 675 | 664 | 667 | 679 | 665 | 657 |
| 1989 | 676 | 645 | 660 | 651 | 646 | 611 | 627 | 615 | 629 | 629 | 622 | 624 |
| 1990 | 637 | 635 | 630 | 621 | 618 | 608 | 586 | 612 | 616 | 633 | 639 | 612 |
| 1991 | 636 | 639 | 631 | 630 | 615 | 612 | 616 | 616 | 606 | 603 | 603 | 602 |
| 1992 | 590 | 606 | 596 | 600 | 603 | 595 | 594 | 568 | 579 | 577 | 587 | 580 |
| 1993 | 568 | 567 | 591 | 574 | 577 | 565 | 568 | 554 | 550 | 546 | 535 | 536 |
| 1994 | 529 | 537 | 535 | 530 | 534 | 536 | 497 | 513 | 542 | 537 | 539 | 535 |
| 1995 | 551 | 598 | 530 | 530 | 529 | 521 | 517 | 508 | 519 | 528 | 529 | 528 |
| 1996 | 537 | 524 | 528 | 532 | 512 | 512 | 510 | 521 | 524 | 520 | 531 | 528 |
| 1997 | 517 | 530 | 530 | 509 | 507 | 509 | 511 | 503 | 510 | 514 | 490 | 506 |
| 1998 | 487 | 482 | 503 | 509 | 473 | 482 | 473 | 470 | 476 | 463 | 463 | 444 |
| 1999 | 451 | 442 | 446 | 461 | 463 | 484 | 483 | 477 | 484 | 486 | 488 | 492 |
| 2000 | 501 | 508 | 513 | 510 | 507 | 516 | 513 | 514 | 520 | 510 | 517 | 491 |
| 2001 | 488 | 510 | 510 | 514 | 508 | 498 | 492 | 495 | 505 | 499 | 504 | 470 |
| 2002 | 501 | 513 | 500 | 514 | 509 | 499 | 496 | 509 | 517 | 524 | 499 | 493 |
| 2003 | 523 | 537 | 518 | 501 | 470 | 484 | 476 | 477 | 494 | 502 | 507 | 506 |
| 2004 | 505 | 487 | 512 | 509 | 514 | 528 | 524 | 532 | 543 | 541 | 544 | 538 |
| 2005 | 533 | 550 | 549 | 537 | 544 | 533 | 535 | 559 | 554 | 553 | 566 | 501 |
| 2006 | 549 | 536 | 568 | 559 | 566 | 560 | 567 | 557 | 569 | 568 | 571 | 563 |
| 2007 | 546 | 557 | 588 | 589 | 589 | 585 | 574 | 587 | 600 | 595 | 625 | 590 |
| 2008 | 589 | 615 | 642 | 644 | 645 | 639 | 630 | 633 | 645 | 664 | 671 | 608 |
| 2009 | 647 | 667 | 673 | 671 | 686 | 675 | 671 | 666 | 665 | 680 | 703 | 684 |
| 2010 | 711 | 709 | 720 | 730 | 739 | 720 | 683 | 726 | 733 | 753 | 744 | 736 |
| 2011 | 729 | 735 | 764 | 759 | 778 | 783 | 784 | 797 | 771 | 816 | 836 | 817 |
| 2012 | 826 | 839 | 848 | 815 | 834 | 809 | 800 | 827 | 847 | 851 | 852 | 790 |
| 2013 | 781 | 807 | 825 | 827 | 849 | 814 | 834 | 874 | 882 | 917 | 939 | 872 |
| 2014 | 901 | 888 | 936 | 968 | 971 | 1,021 | 1,017 | 1,037 | 1,032 | 1,071 | 1,049 | 1,064 |
| 2015 | 1,054 | 1,087 | 1,115 | 1,118 | 1,101 | 1,082 | 1,077 | 1,110 | 1,093 | 1,100 | 1,097 | 1,066 |
| 2016 | 1,031 | 1,041 | 1,067 | 1,050 | 1,039 | 1,033 | 1,014 | 989 | 998 | 1,039 | 1,040 | 983 |
| 2017 | 961 | 1,003 | 1,033 | 1,061 | 1,080 | 1,081 | 1,090 | 1,143 | 1,174 | 1,197 | 1,234 | 1,212 |
| 2018 | 1,220 | 1,218 | 1,252 | 1,260 | 1,254 | 1,219 | 1,240 | 1,333 | 1,365 | 1,380 | 1,398 | 1,389 |
| 2019 | 1,369 | 1,353 | 1,349 | 1,385 | 1,381 | 1,407 | 1,378 | 1,382 | 1,414 | 1,473 | 1,507 | 1,483 |
| 2020 | 1,466 | 1,420 | 1,421 | 1,336 | 1,226 | 1,342 | 1,392 | 1,395 | 1,338 | 1,308 | 1,243 | 1,220 |
| 2021 | 1,286 | 1,215 | 1,244 | 1,315 | 1,340 | 1,333 | 1,344 | 1,351 | 1,339 | 1,412 | 1,417 | 1,397 |
| 2022 | 1,318 | 1,364 | 1,429 | 1,404 | 1,419 | 1,426 | 1,436 | 1,435 | 1,400 | 1,450 | 1,430 | 1,276 |
| 2023 | 1,326 | 1,341 | 1,407 | 1,434 | 1,482 | 1,491 | 1,484 | 1,531 | 1,542 | 1,575 | 1,574 | 1,571 |
| 2024 | 1,472 | |||||||||||
| - = No Data Reported; -- = Not Applicable; NA = Not Available; W = Withheld to avoid disclosure of individual company data. |
| Release Date: 3/29/2024 |
| Next Release Date: 4/30/2024 |