|
Download Data (XLS File) |
|
||||||||
|
||||||||
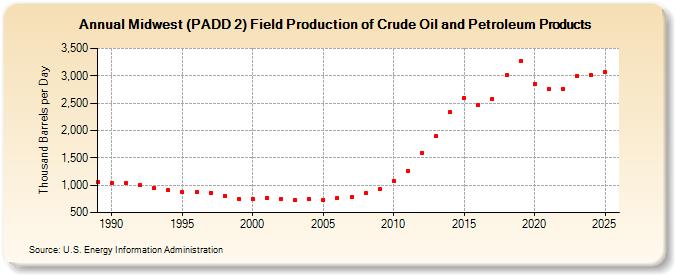
| Midwest (PADD 2) Field Production of Crude Oil and Petroleum Products (Thousand Barrels per Day) | ||||||||
| Decade | Year-0 | Year-1 | Year-2 | Year-3 | Year-4 | Year-5 | Year-6 | Year-7 | Year-8 | Year-9 |
|---|---|---|---|---|---|---|---|---|---|---|
| 1980's | 1,056 | |||||||||
| 1990's | 1,035 | 1,039 | 1,000 | 946 | 905 | 873 | 870 | 859 | 802 | 746 |
| 2000's | 745 | 766 | 754 | 729 | 746 | 738 | 765 | 780 | 855 | 925 |
| 2010's | 1,077 | 1,260 | 1,594 | 1,891 | 2,336 | 2,602 | 2,459 | 2,576 | 3,008 | 3,266 |
| 2020's | 2,852 | 2,760 | 2,765 | 3,004 |
| - = No Data Reported; -- = Not Applicable; NA = Not Available; W = Withheld to avoid disclosure of individual company data. |
| Release Date: 3/29/2024 |
| Next Release Date: 8/30/2024 |