|
Download Data (XLS File) |
|
||||||||
|
||||||||
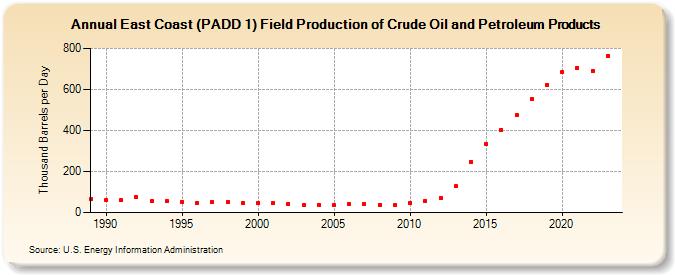
| East Coast (PADD 1) Field Production of Crude Oil and Petroleum Products (Thousand Barrels per Day) | ||||||||
| Decade | Year-0 | Year-1 | Year-2 | Year-3 | Year-4 | Year-5 | Year-6 | Year-7 | Year-8 | Year-9 |
|---|---|---|---|---|---|---|---|---|---|---|
| 1980's | 67 | |||||||||
| 1990's | 61 | 59 | 74 | 55 | 56 | 53 | 48 | 52 | 52 | 48 |
| 2000's | 47 | 46 | 44 | 38 | 38 | 36 | 41 | 40 | 39 | 35 |
| 2010's | 46 | 57 | 71 | 128 | 248 | 336 | 404 | 476 | 555 | 623 |
| 2020's | 686 | 706 | 691 | 765 |
| - = No Data Reported; -- = Not Applicable; NA = Not Available; W = Withheld to avoid disclosure of individual company data. |
| Release Date: 3/29/2024 |
| Next Release Date: 8/30/2024 |