|
Download Data (XLS File) |
|
||||||||
|
||||||||
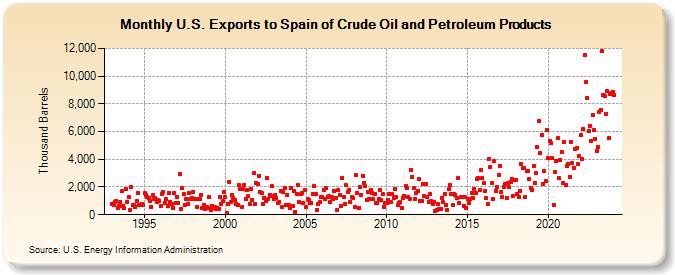
| U.S. Exports to Spain of Crude Oil and Petroleum Products (Thousand Barrels) | ||||||||
| Year | Jan | Feb | Mar | Apr | May | Jun | Jul | Aug | Sep | Oct | Nov | Dec |
|---|---|---|---|---|---|---|---|---|---|---|---|---|
| 1993 | 741 | 695 | 930 | 994 | 512 | 652 | 925 | 1,690 | 648 | 481 | 1,843 | 934 |
| 1994 | 1,269 | 362 | 1,972 | 693 | 685 | 577 | 994 | 1,584 | 730 | 679 | 801 | 705 |
| 1995 | 1,545 | 1,454 | 1,249 | 1,206 | 1,009 | 571 | 1,402 | 1,120 | 1,171 | 941 | 1,036 | 1,003 |
| 1996 | 622 | 1,505 | 1,617 | 848 | 1,129 | 625 | 1,563 | 938 | 764 | 503 | 1,569 | 874 |
| 1997 | 1,287 | 879 | 2,907 | 401 | 1,895 | 1,459 | 735 | 1,117 | 740 | 1,566 | 1,112 | 1,172 |
| 1998 | 1,672 | 1,135 | 1,151 | 537 | 1,144 | 1,123 | 1,452 | 492 | 718 | 399 | 530 | 489 |
| 1999 | 1,282 | 314 | 663 | 509 | 559 | 429 | 496 | 405 | 1,300 | 793 | 985 | 1,642 |
| 2000 | 1,244 | 95 | 780 | 2,341 | 914 | 1,407 | 1,209 | 1,054 | 792 | 689 | 2,125 | 1,850 |
| 2001 | 542 | 1,845 | 2,138 | 1,148 | 1,758 | 1,376 | 778 | 1,866 | 1,060 | 2,980 | 788 | 2,318 |
| 2002 | 2,233 | 2,808 | 1,607 | 1,581 | 797 | 1,234 | 986 | 2,650 | 1,131 | 1,396 | 1,337 | 2,051 |
| 2003 | 1,131 | 1,410 | 1,206 | 858 | 951 | 1,728 | 526 | 1,668 | 1,924 | 714 | 1,410 | 725 |
| 2004 | 468 | 1,945 | 602 | 1,743 | 228 | 1,504 | 2,152 | 906 | 1,476 | 1,588 | 869 | 1,810 |
| 2005 | 523 | 1,106 | 1,064 | 813 | 848 | 1,522 | 2,100 | 1,482 | 369 | 787 | 912 | 1,267 |
| 2006 | 1,275 | 1,807 | 1,100 | 1,903 | 1,307 | 1,346 | 936 | 1,244 | 1,164 | 1,729 | 1,188 | 360 |
| 2007 | 1,802 | 1,433 | 611 | 2,674 | 1,285 | 797 | 2,139 | 1,632 | 1,817 | 942 | 1,287 | 1,173 |
| 2008 | 577 | 2,896 | 1,536 | 484 | 2,018 | 1,447 | 2,812 | 2,296 | 2,048 | 1,033 | 1,645 | 1,152 |
| 2009 | 1,818 | 1,581 | 1,121 | 1,508 | 850 | 852 | 1,155 | 1,772 | 1,059 | 1,476 | 557 | 835 |
| 2010 | 831 | 1,063 | 1,473 | 923 | 1,484 | 1,220 | 1,831 | 1,270 | 672 | 855 | 906 | 507 |
| 2011 | 1,226 | 1,350 | 2,095 | 1,922 | 1,254 | 1,141 | 3,239 | 2,705 | 1,919 | 1,129 | 1,564 | 1,732 |
| 2012 | 2,541 | 1,006 | 985 | 2,190 | 1,360 | 2,213 | 1,242 | 935 | 1,489 | 1,006 | 803 | 904 |
| 2013 | 257 | 373 | 742 | 395 | 419 | 1,192 | 896 | 1,462 | 727 | 350 | 1,852 | 2,130 |
| 2014 | 1,466 | 693 | 1,502 | 1,424 | 1,209 | 2,633 | 881 | 1,279 | 1,258 | 605 | 1,254 | 485 |
| 2015 | 1,101 | 865 | 1,123 | 1,584 | 1,215 | 1,868 | 1,542 | 2,561 | 2,619 | 1,751 | 3,216 | 2,626 |
| 2016 | 2,292 | 1,701 | 1,170 | 790 | 4,012 | 3,463 | 2,279 | 1,113 | 3,853 | 1,747 | 2,017 | 2,890 |
| 2017 | 3,526 | 1,653 | 1,283 | 1,999 | 2,216 | 1,226 | 2,277 | 1,973 | 2,330 | 2,548 | 1,329 | 2,532 |
| 2018 | 2,531 | 1,508 | 1,307 | 1,721 | 3,623 | 3,345 | 3,360 | 1,243 | 3,123 | 3,118 | 2,603 | 1,934 |
| 2019 | 1,792 | 3,530 | 2,320 | 3,008 | 4,865 | 6,748 | 4,422 | 5,773 | 2,188 | 3,127 | 2,411 | 6,077 |
| 2020 | 4,102 | 5,336 | 5,151 | 4,069 | 688 | 3,104 | 3,854 | 5,506 | 2,630 | 3,946 | 4,520 | 2,284 |
| 2021 | 5,235 | 2,167 | 3,538 | 3,629 | 2,747 | 5,224 | 3,722 | 3,399 | 4,713 | 4,778 | 3,646 | 4,234 |
| 2022 | 5,746 | 4,054 | 6,198 | 11,502 | 9,581 | 8,396 | 6,039 | 6,433 | 5,333 | 7,228 | 6,126 | 5,460 |
| 2023 | 4,596 | 4,852 | 7,421 | 7,580 | 11,805 | 8,658 | 8,566 | 7,276 | 8,899 | 5,528 | 8,699 | 8,810 |
| 2024 | 8,848 | |||||||||||
| - = No Data Reported; -- = Not Applicable; NA = Not Available; W = Withheld to avoid disclosure of individual company data. |
| Release Date: 3/29/2024 |
| Next Release Date: 4/30/2024 |