|
Download Data (XLS File) |
|
||||||||
|
||||||||
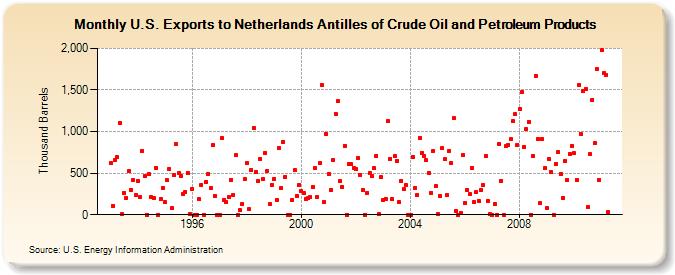
| U.S. Exports to Netherlands Antilles of Crude Oil and Petroleum Products (Thousand Barrels) | ||||||||
| Year | Jan | Feb | Mar | Apr | May | Jun | Jul | Aug | Sep | Oct | Nov | Dec |
|---|---|---|---|---|---|---|---|---|---|---|---|---|
| 1993 | 617 | 109 | 654 | 692 | 1,100 | 7 | 265 | 203 | 521 | 298 | 416 | 233 |
| 1994 | 409 | 214 | 772 | 467 | 1 | 485 | 210 | 198 | 566 | 2 | 185 | 324 |
| 1995 | 148 | 413 | 550 | 76 | 478 | 845 | 497 | 463 | 248 | 276 | 501 | 11 |
| 1996 | 312 | 1 | 1 | 183 | 363 | 2 | 399 | 492 | 317 | 838 | 227 | 2 |
| 1997 | 1 | 925 | 181 | 152 | 209 | 421 | 242 | 714 | 1 | 52 | 131 | 426 |
| 1998 | 616 | 65 | 535 | 1,047 | 518 | 411 | 674 | 426 | 748 | 526 | 125 | 361 |
| 1999 | 430 | 182 | 798 | 321 | 875 | 458 | 2 | 1 | 182 | 533 | 227 | 360 |
| 2000 | 281 | 258 | 194 | 196 | 211 | 332 | 556 | 214 | 623 | 1,557 | 155 | 973 |
| 2001 | 491 | 303 | 655 | 1,214 | 1,363 | 405 | 335 | 832 | 1 | 606 | 606 | 567 |
| 2002 | 547 | 680 | 477 | 297 | 2 | 266 | 500 | 464 | 558 | 712 | 3 | 449 |
| 2003 | 180 | 193 | 1,122 | 675 | 183 | 701 | 651 | 149 | 411 | 309 | 357 | 2 |
| 2004 | 1 | 699 | 324 | 238 | 926 | 746 | 706 | 654 | 506 | 266 | 769 | 344 |
| 2005 | 3 | 224 | 798 | 665 | 240 | 770 | 624 | 1,159 | 41 | 1 | 21 | 718 |
| 2006 | 136 | 301 | 246 | 565 | 151 | 271 | 166 | 300 | 356 | 706 | 169 | 7 |
| 2007 | 1 | 123 | 1 | 850 | 410 | 2 | 822 | 838 | 906 | 1,121 | 1,208 | 842 |
| 2008 | 1,273 | 1,470 | 816 | 1,027 | 1,120 | 2 | 703 | 1,671 | 908 | 136 | 912 | 561 |
| 2009 | 77 | 667 | 509 | 1 | 613 | 757 | 492 | 202 | 643 | 421 | 732 | 827 |
| 2010 | 737 | 420 | 1,560 | 970 | 1,488 | 1,512 | 93 | 727 | 1,384 | 858 | 1,747 | 420 |
| 2011 | 1,980 | 1,705 | 1,683 | 32 | ||||||||
| - = No Data Reported; -- = Not Applicable; NA = Not Available; W = Withheld to avoid disclosure of individual company data. |
| Release Date: 3/29/2024 |
| Next Release Date: 4/30/2024 |