|
Download Data (XLS File) |
|
||||||||
|
||||||||
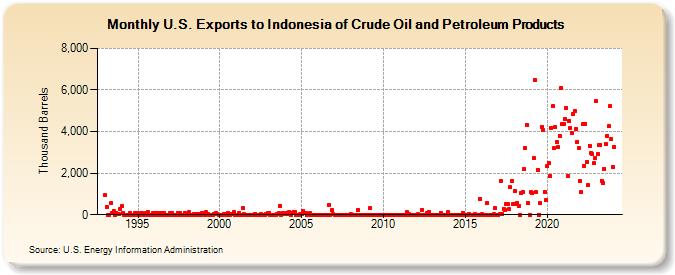
| U.S. Exports to Indonesia of Crude Oil and Petroleum Products (Thousand Barrels) | ||||||||
| Year | Jan | Feb | Mar | Apr | May | Jun | Jul | Aug | Sep | Oct | Nov | Dec |
|---|---|---|---|---|---|---|---|---|---|---|---|---|
| 1993 | 938 | 372 | 4 | 4 | 553 | 84 | 196 | 1 | 84 | 12 | 12 | 281 |
| 1994 | 401 | 82 | 3 | 0 | 9 | 3 | 97 | 3 | 8 | 3 | 81 | 95 |
| 1995 | 2 | 2 | 95 | 84 | 3 | 3 | 94 | 107 | 3 | 2 | 3 | 94 |
| 1996 | 7 | 93 | 4 | 87 | 6 | 86 | 2 | 86 | 2 | 3 | 1 | 85 |
| 1997 | 2 | 60 | 1 | 2 | 4 | 88 | 6 | 92 | 6 | 3 | 86 | 3 |
| 1998 | 1 | 115 | 0 | 1 | 1 | 34 | 1 | 32 | 0 | 33 | 0 | 83 |
| 1999 | 34 | 1 | 116 | 56 | 1 | 0 | 1 | 2 | 35 | 95 | 37 | 7 |
| 2000 | 4 | 10 | 2 | 13 | 35 | 2 | 89 | 3 | 23 | 14 | 126 | 2 |
| 2001 | 2 | 1 | 93 | 2 | 6 | 301 | 22 | 3 | 5 | 2 | 1 | 3 |
| 2002 | 2 | 3 | 36 | 1 | 2 | 2 | 33 | 1 | 1 | 1 | 47 | 60 |
| 2003 | 92 | 2 | 2 | 0 | 3 | 5 | 17 | 70 | 434 | 1 | 75 | 46 |
| 2004 | 45 | 106 | 44 | 142 | 2 | 60 | 148 | 113 | 1 | 1 | 3 | 26 |
| 2005 | 52 | 183 | 60 | 92 | 1 | 49 | 70 | 3 | 5 | 3 | 1 | 1 |
| 2006 | 1 | 1 | 1 | 2 | 1 | 2 | 1 | 2 | 450 | 2 | 205 | 18 |
| 2007 | 0 | 1 | 9 | 2 | 1 | 1 | 7 | 2 | 7 | 4 | 3 | 1 |
| 2008 | 21 | 2 | 1 | 1 | 6 | 234 | 2 | 1 | 1 | 4 | 5 | 0 |
| 2009 | 1 | 1 | 315 | 1 | 0 | 2 | 1 | 1 | 5 | 1 | 9 | 1 |
| 2010 | 2 | 8 | 4 | 9 | 5 | 1 | 2 | 4 | 2 | 4 | 2 | 10 |
| 2011 | 2 | 8 | 4 | 2 | 8 | 127 | 8 | 11 | 4 | 10 | 7 | 4 |
| 2012 | 3 | 12 | 4 | 3 | 244 | 8 | 6 | 9 | 104 | 152 | 8 | 3 |
| 2013 | 3 | 4 | 4 | 4 | 5 | 3 | 104 | 5 | 3 | 3 | 3 | 119 |
| 2014 | 3 | 4 | 4 | 5 | 8 | 2 | 3 | 2 | 2 | 3 | 106 | 3 |
| 2015 | 4 | 5 | 6 | 14 | 2 | 2 | 5 | 16 | 3 | 2 | 2 | 752 |
| 2016 | 16 | 3 | 5 | 2 | 568 | 4 | 3 | 9 | 8 | 20 | 303 | 1 |
| 2017 | 3 | 19 | 1,645 | 36 | 277 | 237 | 527 | 514 | 278 | 1,324 | 1,632 | 517 |
| 2018 | 1,117 | 519 | 572 | 401 | 4 | 1,068 | 1,070 | 2,196 | 3,216 | 4,328 | 541 | 2 |
| 2019 | 1,090 | 1,068 | 2,725 | 6,484 | 1,073 | 2,173 | 5 | 557 | 4,236 | 4,080 | 1,105 | 696 |
| 2020 | 2,350 | 2,487 | 1,862 | 4,163 | 5,210 | 3,190 | 4,240 | 3,502 | 3,255 | 3,799 | 6,077 | 4,363 |
| 2021 | 4,345 | 4,606 | 5,152 | 1,869 | 4,521 | 4,171 | 3,938 | 4,854 | 4,967 | 4,131 | 3,504 | 3,225 |
| 2022 | 1,631 | 1,089 | 4,343 | 2,364 | 4,386 | 2,540 | 1,416 | 3,329 | 2,978 | 2,916 | 2,472 | 2,704 |
| 2023 | 5,456 | 2,914 | 3,346 | 3,346 | 1,640 | 1,522 | 2,218 | 3,403 | 3,795 | 4,250 | 5,216 | 3,642 |
| 2024 | 2,306 | |||||||||||
| - = No Data Reported; -- = Not Applicable; NA = Not Available; W = Withheld to avoid disclosure of individual company data. |
| Release Date: 3/29/2024 |
| Next Release Date: 4/30/2024 |