|
Download Data (XLS File) |
|
||||||||
|
||||||||
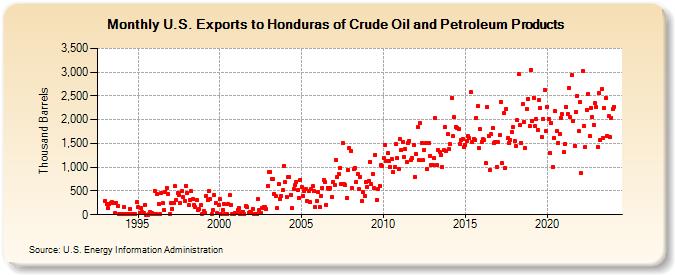
| U.S. Exports to Honduras of Crude Oil and Petroleum Products (Thousand Barrels) | ||||||||
| Year | Jan | Feb | Mar | Apr | May | Jun | Jul | Aug | Sep | Oct | Nov | Dec |
|---|---|---|---|---|---|---|---|---|---|---|---|---|
| 1993 | 295 | 219 | 140 | 224 | 239 | 262 | 245 | 31 | 254 | 188 | 6 | 10 |
| 1994 | 10 | 11 | 158 | 13 | 16 | 8 | 123 | 7 | 10 | 12 | 7 | 259 |
| 1995 | 154 | 31 | 149 | 57 | 37 | 208 | 4 | 4 | 8 | 59 | 37 | 10 |
| 1996 | 505 | 15 | 434 | 224 | 7 | 462 | 245 | 90 | 481 | 571 | 441 | 7 |
| 1997 | 239 | 129 | 249 | 598 | 317 | 452 | 422 | 254 | 489 | 371 | 296 | 611 |
| 1998 | 447 | 204 | 304 | 493 | 322 | 200 | 152 | 310 | 109 | 111 | 205 | 9 |
| 1999 | 72 | 43 | 399 | 305 | 492 | 321 | 11 | 99 | 414 | 251 | 32 | 205 |
| 2000 | 325 | 8 | 90 | 217 | 8 | 12 | 222 | 409 | 214 | 7 | 5 | 44 |
| 2001 | 42 | 97 | 144 | 6 | 47 | 58 | 7 | 173 | 152 | 38 | 64 | 66 |
| 2002 | 129 | 7 | 12 | 23 | 322 | 91 | 34 | 150 | 166 | 158 | 119 | 604 |
| 2003 | 893 | 903 | 747 | 748 | 444 | 389 | 132 | 643 | 323 | 400 | 511 | 1,023 |
| 2004 | 682 | 369 | 795 | 789 | 410 | 140 | 533 | 617 | 697 | 516 | 351 | 741 |
| 2005 | 573 | 400 | 489 | 544 | 292 | 507 | 262 | 547 | 597 | 490 | 152 | 287 |
| 2006 | 479 | 163 | 404 | 559 | 720 | 684 | 209 | 569 | 549 | 559 | 370 | 692 |
| 2007 | 619 | 1,153 | 802 | 861 | 981 | 640 | 1,499 | 644 | 615 | 361 | 947 | 1,403 |
| 2008 | 1,345 | 553 | 952 | 991 | 684 | 849 | 533 | 798 | 279 | 468 | 397 | 680 |
| 2009 | 582 | 712 | 1,119 | 640 | 847 | 553 | 1,263 | 318 | 550 | 611 | 1,037 | 1,020 |
| 2010 | 1,187 | 1,474 | 1,123 | 1,290 | 1,131 | 996 | 1,168 | 895 | 1,001 | 1,488 | 1,186 | 953 |
| 2011 | 1,596 | 1,366 | 1,520 | 1,218 | 1,385 | 1,104 | 1,516 | 1,555 | 1,153 | 1,192 | 1,474 | 803 |
| 2012 | 1,275 | 1,836 | 1,143 | 1,924 | 1,511 | 1,147 | 1,369 | 1,513 | 959 | 1,503 | 1,242 | 1,052 |
| 2013 | 1,047 | 1,190 | 2,025 | 1,040 | 1,361 | 1,322 | 1,260 | 997 | 1,354 | 1,838 | 1,351 | 1,697 |
| 2014 | 1,376 | 1,482 | 2,463 | 1,647 | 2,050 | 1,855 | 1,831 | 1,796 | 1,494 | 1,565 | 1,597 | 1,419 |
| 2015 | 1,475 | 1,542 | 1,650 | 1,605 | 2,573 | 1,531 | 1,591 | 1,578 | 2,036 | 2,289 | 1,398 | 1,795 |
| 2016 | 1,528 | 1,586 | 1,576 | 1,078 | 2,262 | 1,663 | 937 | 1,692 | 1,830 | 1,515 | 1,533 | 1,012 |
| 2017 | 1,526 | 1,672 | 2,377 | 1,080 | 2,131 | 976 | 2,225 | 1,606 | 1,501 | 1,571 | 1,738 | 1,836 |
| 2018 | 1,555 | 1,443 | 1,984 | 2,952 | 1,886 | 1,519 | 2,320 | 1,958 | 1,406 | 2,230 | 2,440 | 1,864 |
| 2019 | 3,049 | 1,971 | 2,466 | 1,866 | 2,012 | 1,788 | 2,422 | 2,246 | 1,637 | 2,011 | 2,626 | 1,759 |
| 2020 | 2,275 | 2,020 | 1,299 | 1,929 | 1,003 | 1,613 | 2,172 | 1,765 | 1,515 | 1,702 | 2,036 | 2,110 |
| 2021 | 1,317 | 1,490 | 2,274 | 2,122 | 2,672 | 2,046 | 2,944 | 1,967 | 1,455 | 2,166 | 2,504 | 1,758 |
| 2022 | 2,362 | 871 | 3,026 | 1,867 | 1,425 | 2,208 | 2,542 | 1,656 | 2,252 | 2,056 | 1,893 | 2,344 |
| 2023 | 2,265 | 1,427 | 2,562 | 1,567 | 2,645 | 1,621 | 2,241 | 2,462 | 1,653 | 2,068 | 1,627 | 2,043 |
| 2024 | 2,225 | |||||||||||
| - = No Data Reported; -- = Not Applicable; NA = Not Available; W = Withheld to avoid disclosure of individual company data. |
| Release Date: 3/29/2024 |
| Next Release Date: 4/30/2024 |