|
Download Data (XLS File) |
|
||||||||
|
||||||||
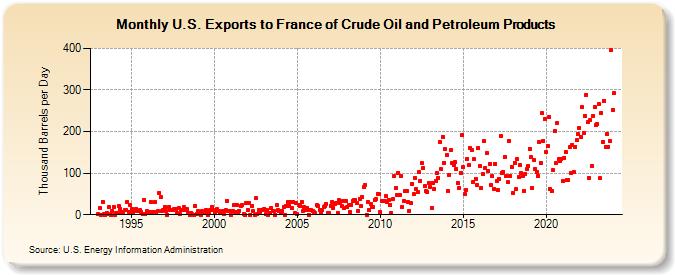
| U.S. Exports to France of Crude Oil and Petroleum Products (Thousand Barrels per Day) | ||||||||
| Year | Jan | Feb | Mar | Apr | May | Jun | Jul | Aug | Sep | Oct | Nov | Dec |
|---|---|---|---|---|---|---|---|---|---|---|---|---|
| 1993 | 2 | 15 | 0 | 31 | 1 | 0 | 5 | 1 | 18 | 0 | 9 | 19 |
| 1994 | 0 | 3 | 5 | 20 | 14 | 6 | 7 | 11 | 11 | 30 | 7 | 23 |
| 1995 | 14 | 7 | 12 | 14 | 10 | 8 | 11 | 7 | 1 | 36 | 2 | 8 |
| 1996 | 6 | 7 | 31 | 6 | 6 | 30 | 6 | 8 | 53 | 42 | 9 | 11 |
| 1997 | 19 | 8 | 0 | 18 | 12 | 12 | 12 | 14 | 13 | 4 | 16 | 2 |
| 1998 | 12 | 11 | 18 | 11 | 13 | 5 | 0 | 5 | 1 | 0 | 22 | 2 |
| 1999 | 8 | 1 | 0 | 8 | 7 | 6 | 12 | 0 | 4 | 11 | 18 | 12 |
| 2000 | 4 | 11 | 13 | 9 | 5 | 6 | 10 | 2 | 11 | 34 | 9 | 8 |
| 2001 | 0 | 9 | 23 | 7 | 24 | 7 | 10 | 21 | 23 | 1 | 0 | 29 |
| 2002 | 11 | 28 | 0 | 21 | 8 | 0 | 39 | 1 | 12 | 4 | 11 | 11 |
| 2003 | 14 | 1 | 11 | 0 | 3 | 17 | 9 | 8 | 0 | 23 | 11 | 10 |
| 2004 | 5 | 8 | 18 | 0 | 21 | 31 | 20 | 31 | 16 | 30 | 4 | 28 |
| 2005 | 1 | 24 | 21 | 31 | 10 | 19 | 11 | 17 | 0 | 12 | 11 | 9 |
| 2006 | 7 | 4 | 23 | 20 | 12 | 4 | 11 | 19 | 21 | 26 | 5 | 3 |
| 2007 | 22 | 30 | 17 | 25 | 29 | 4 | 35 | 29 | 20 | 34 | 15 | 33 |
| 2008 | 18 | 24 | 7 | 24 | 33 | 36 | 36 | 29 | 9 | 38 | 22 | 43 |
| 2009 | 66 | 72 | 0 | 31 | 12 | 26 | 19 | 18 | 35 | 38 | 50 | 49 |
| 2010 | 6 | 34 | 33 | 32 | 45 | 30 | 36 | 23 | 4 | 38 | 93 | 64 |
| 2011 | 48 | 101 | 48 | 92 | 19 | 34 | 58 | 57 | 31 | 10 | 28 | 75 |
| 2012 | 49 | 88 | 61 | 54 | 102 | 82 | 124 | 113 | 69 | 57 | 54 | 77 |
| 2013 | 67 | 17 | 77 | 62 | 81 | 100 | 89 | 176 | 109 | 188 | 125 | 157 |
| 2014 | 143 | 56 | 95 | 155 | 125 | 119 | 126 | 111 | 76 | 65 | 101 | 191 |
| 2015 | 114 | 49 | 60 | 135 | 120 | 160 | 156 | 78 | 133 | 86 | 72 | 160 |
| 2016 | 118 | 64 | 98 | 177 | 113 | 148 | 106 | 122 | 71 | 93 | 63 | 123 |
| 2017 | 81 | 59 | 87 | 189 | 101 | 103 | 139 | 94 | 78 | 178 | 93 | 115 |
| 2018 | 53 | 125 | 61 | 133 | 91 | 119 | 100 | 93 | 58 | 99 | 110 | 118 |
| 2019 | 159 | 138 | 64 | 131 | 111 | 102 | 94 | 174 | 125 | 244 | 178 | 229 |
| 2020 | 151 | 165 | 236 | 61 | 56 | 107 | 201 | 125 | 221 | 133 | 128 | 133 |
| 2021 | 81 | 137 | 151 | 83 | 83 | 162 | 100 | 168 | 102 | 164 | 179 | 193 |
| 2022 | 209 | 186 | 259 | 197 | 238 | 289 | 222 | 89 | 227 | 118 | 238 | 259 |
| 2023 | 215 | 218 | 266 | 88 | 245 | 176 | 274 | 164 | 194 | 163 | 177 | 395 |
| 2024 | 252 | |||||||||||
| - = No Data Reported; -- = Not Applicable; NA = Not Available; W = Withheld to avoid disclosure of individual company data. |
| Release Date: 3/29/2024 |
| Next Release Date: 4/30/2024 |