|
Download Data (XLS File) |
|
||||||||
|
||||||||
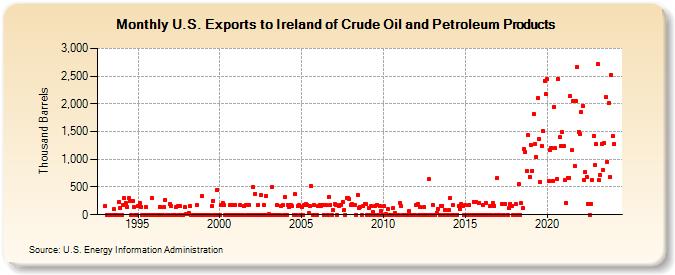
| U.S. Exports to Ireland of Crude Oil and Petroleum Products (Thousand Barrels) | ||||||||
| Year | Jan | Feb | Mar | Apr | May | Jun | Jul | Aug | Sep | Oct | Nov | Dec |
|---|---|---|---|---|---|---|---|---|---|---|---|---|
| 1993 | 155 | 0 | 0 | 0 | 0 | 0 | 97 | 1 | 0 | 0 | 238 | 113 |
| 1994 | 1 | 179 | 299 | 209 | 134 | 301 | 243 | 1 | 249 | 133 | 0 | 0 |
| 1995 | 166 | 204 | 144 | 0 | 2 | 0 | 137 | 1 | 0 | 0 | 298 | 1 |
| 1996 | 0 | 1 | 0 | 0 | 144 | 3 | 1 | 135 | 270 | 1 | 0 | 190 |
| 1997 | 152 | 1 | 2 | 2 | 135 | 154 | 2 | 150 | 1 | 0 | 140 | 4 |
| 1998 | 10 | 30 | 152 | 0 | 0 | 0 | 0 | 171 | 1 | 0 | 0 | 334 |
| 1999 | 1 | 0 | 1 | 0 | 0 | 0 | 151 | 255 | 0 | 0 | 447 | 0 |
| 2000 | 1 | 182 | 214 | 173 | 0 | 0 | 1 | 167 | 0 | 182 | 0 | 182 |
| 2001 | 0 | 0 | 0 | 173 | 1 | 0 | 159 | 183 | 0 | 182 | 1 | 1 |
| 2002 | 496 | 0 | 379 | 0 | 179 | 1 | 354 | 0 | 179 | 1 | 338 | 0 |
| 2003 | 5 | 0 | 494 | 1 | 1 | 2 | 184 | 0 | 1 | 160 | 169 | 1 |
| 2004 | 315 | 1 | 167 | 144 | 176 | 152 | 1 | 365 | 0 | 150 | 167 | 1 |
| 2005 | 145 | 1 | 182 | 191 | 174 | 24 | 156 | 516 | 1 | 179 | 0 | 1 |
| 2006 | 156 | 182 | 166 | 180 | 0 | 182 | 179 | 1 | 322 | 182 | 1 | 78 |
| 2007 | 192 | 182 | 1 | 162 | 181 | 175 | 235 | 84 | 1 | 302 | 302 | 290 |
| 2008 | 183 | 193 | 180 | 172 | 1 | 356 | 117 | 143 | 1 | 156 | 194 | 185 |
| 2009 | 1 | 129 | 1 | 157 | 45 | 1 | 154 | 182 | 1 | 150 | 58 | 1 |
| 2010 | 152 | 2 | 5 | 96 | 1 | 1 | 1 | 113 | 26 | 1 | 1 | 0 |
| 2011 | 211 | 156 | 2 | 0 | 1 | 2 | 1 | 64 | 2 | 1 | 1 | 1 |
| 2012 | 180 | 196 | 2 | 133 | 1 | 1 | 139 | 1 | 1 | 644 | 2 | 1 |
| 2013 | 174 | 0 | 2 | 37 | 112 | 1 | 162 | 165 | 0 | 90 | 1 | 0 |
| 2014 | 84 | 300 | 1 | 168 | 1 | 0 | 1 | 149 | 107 | 191 | 155 | 0 |
| 2015 | 168 | 0 | 1 | 180 | 1 | 0 | 234 | 1 | 228 | 1 | 212 | 0 |
| 2016 | 0 | 170 | 1 | 220 | 0 | 0 | 150 | 0 | 212 | 165 | 0 | 660 |
| 2017 | 0 | 1 | 197 | 0 | 189 | 0 | 120 | 200 | 165 | 1 | ||
| 2018 | 188 | 0 | 549 | 0 | 209 | 118 | 1,178 | 1,134 | 788 | 1,432 | 687 | |
| 2019 | 1,260 | 791 | 1,822 | 1,284 | 1,046 | 2,103 | 1,374 | 593 | 1,247 | 1,509 | 2,420 | 2,172 |
| 2020 | 2,442 | 601 | 1,176 | 1,209 | 605 | 1,946 | 1,201 | 636 | 2,441 | 1,395 | 1,245 | 1,483 |
| 2021 | 1,231 | 624 | 212 | 670 | 671 | 2,140 | 1,161 | 2,047 | 881 | 2,044 | 2,661 | 1,493 |
| 2022 | 1,452 | 1,850 | 1,962 | 626 | 768 | 678 | 202 | 0 | 194 | 632 | 1,421 | 889 |
| 2023 | 1,269 | 2,719 | 619 | 720 | 1,276 | 809 | 1,294 | 2,122 | 957 | 2,010 | 681 | 2,524 |
| 2024 | 1,418 | |||||||||||
| - = No Data Reported; -- = Not Applicable; NA = Not Available; W = Withheld to avoid disclosure of individual company data. |
| Release Date: 3/29/2024 |
| Next Release Date: 4/30/2024 |