|
Download Data (XLS File) |
|
||||||||
|
||||||||
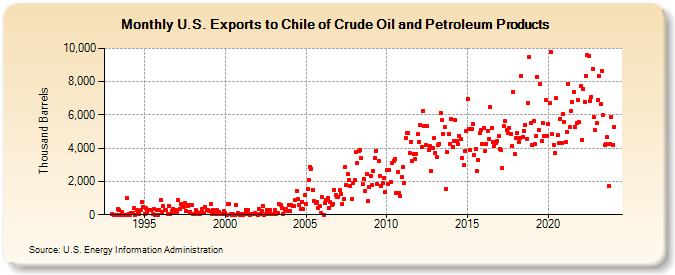
| U.S. Exports to Chile of Crude Oil and Petroleum Products (Thousand Barrels) | ||||||||
| Year | Jan | Feb | Mar | Apr | May | Jun | Jul | Aug | Sep | Oct | Nov | Dec |
|---|---|---|---|---|---|---|---|---|---|---|---|---|
| 1993 | 16 | 7 | 3 | 5 | 325 | 279 | 4 | 149 | 4 | 7 | 3 | 1,033 |
| 1994 | 31 | 5 | 110 | 110 | 401 | 6 | 290 | 150 | 58 | 268 | 772 | 475 |
| 1995 | 33 | 409 | 141 | 292 | 266 | 283 | 17 | 356 | 12 | 286 | 6 | 312 |
| 1996 | 907 | 169 | 515 | 289 | 280 | 44 | 515 | 24 | 242 | 353 | 179 | 278 |
| 1997 | 123 | 857 | 359 | 621 | 527 | 488 | 702 | 197 | 516 | 581 | 180 | 593 |
| 1998 | 21 | 47 | 295 | 142 | 27 | 39 | 91 | 326 | 109 | 492 | 256 | 278 |
| 1999 | 206 | 632 | 33 | 300 | 22 | 21 | 268 | 167 | 64 | 19 | 24 | 248 |
| 2000 | 116 | 7 | 660 | 656 | 56 | 7 | 22 | 8 | 582 | 89 | 15 | 8 |
| 2001 | 18 | 11 | 29 | 311 | 17 | 284 | 8 | 57 | 15 | 39 | 91 | 17 |
| 2002 | 9 | 345 | 13 | 217 | 512 | 6 | 20 | 276 | 32 | 272 | 73 | 14 |
| 2003 | 44 | 271 | 36 | 77 | 650 | 590 | 390 | 52 | 262 | 354 | 225 | 571 |
| 2004 | 233 | 571 | 547 | 499 | 887 | 1,449 | 944 | 612 | 323 | 787 | 334 | 1,163 |
| 2005 | 673 | 1,518 | 2,060 | 2,870 | 2,768 | 1,481 | 838 | 708 | 786 | 424 | 519 | 94 |
| 2006 | 1,092 | 5 | 686 | 861 | 1,032 | 379 | 748 | 558 | 672 | 1,508 | 1,161 | 1,067 |
| 2007 | 1,054 | 1,458 | 1,253 | 661 | 928 | 2,886 | 1,765 | 2,437 | 2,075 | 1,747 | 970 | 1,936 |
| 2008 | 2,076 | 3,791 | 3,112 | 3,827 | 3,877 | 3,387 | 1,825 | 2,158 | 1,455 | 2,433 | 830 | 1,637 |
| 2009 | 2,350 | 1,765 | 2,603 | 3,426 | 3,859 | 1,817 | 3,228 | 2,316 | 1,755 | 1,889 | 2,226 | 1,350 |
| 2010 | 2,701 | 1,856 | 2,684 | 1,947 | 3,120 | 3,253 | 3,354 | 1,277 | 2,546 | 1,298 | 1,110 | 2,242 |
| 2011 | 2,890 | 1,911 | 4,614 | 4,918 | 4,931 | 3,737 | 4,391 | 3,217 | 3,621 | 3,362 | 3,661 | 4,836 |
| 2012 | 4,387 | 5,376 | 4,042 | 6,252 | 5,362 | 4,174 | 5,343 | 3,905 | 4,121 | 2,616 | 4,028 | 4,583 |
| 2013 | 3,700 | 3,455 | 4,173 | 4,272 | 6,138 | 5,708 | 4,879 | 5,254 | 1,567 | 3,764 | 4,837 | 4,257 |
| 2014 | 5,763 | 4,084 | 4,458 | 5,673 | 4,448 | 4,228 | 4,761 | 4,533 | 3,426 | 2,960 | 3,848 | 5,022 |
| 2015 | 6,959 | 5,167 | 3,896 | 5,171 | 5,473 | 3,572 | 3,952 | 2,606 | 3,290 | 4,884 | 5,118 | 4,234 |
| 2016 | 5,235 | 3,832 | 4,269 | 5,058 | 4,557 | 6,465 | 5,211 | 4,374 | 4,133 | 4,291 | 4,438 | 4,720 |
| 2017 | 3,921 | 3,919 | 2,836 | 5,327 | 5,621 | 5,094 | 4,900 | 5,185 | 4,866 | 4,139 | 7,358 | 3,626 |
| 2018 | 4,626 | 4,899 | 4,348 | 4,638 | 8,354 | 4,645 | 5,005 | 5,369 | 4,535 | 6,692 | 9,499 | 5,486 |
| 2019 | 4,207 | 5,647 | 4,226 | 4,761 | 8,303 | 5,066 | 7,857 | 4,423 | 5,510 | 4,747 | 6,893 | 4,725 |
| 2020 | 5,472 | 6,693 | 9,812 | 4,843 | 4,211 | 3,689 | 7,002 | 4,766 | 4,282 | 5,770 | 4,282 | 6,077 |
| 2021 | 5,548 | 4,392 | 4,958 | 7,850 | 5,252 | 6,257 | 6,782 | 7,378 | 5,298 | 5,486 | 6,899 | 5,546 |
| 2022 | 7,713 | 4,489 | 7,549 | 6,800 | 8,338 | 9,600 | 9,569 | 6,813 | 7,096 | 8,773 | 5,867 | 5,067 |
| 2023 | 5,540 | 6,916 | 8,343 | 6,629 | 8,637 | 5,968 | 4,183 | 4,228 | 4,650 | 1,720 | 4,239 | 5,878 |
| 2024 | 4,213 | |||||||||||
| - = No Data Reported; -- = Not Applicable; NA = Not Available; W = Withheld to avoid disclosure of individual company data. |
| Release Date: 3/29/2024 |
| Next Release Date: 4/30/2024 |