|
Download Data (XLS File) |
|
||||||||
|
||||||||
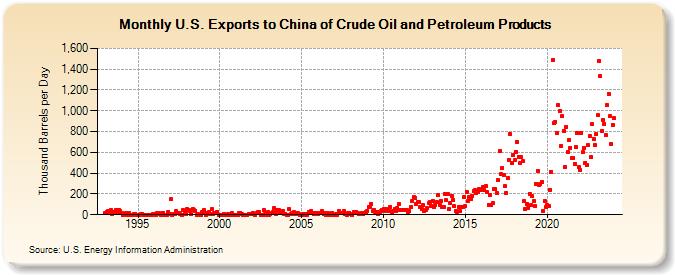
| U.S. Exports to China of Crude Oil and Petroleum Products (Thousand Barrels per Day) | ||||||||
| Year | Jan | Feb | Mar | Apr | May | Jun | Jul | Aug | Sep | Oct | Nov | Dec |
|---|---|---|---|---|---|---|---|---|---|---|---|---|
| 1993 | 15 | 30 | 32 | 18 | 43 | 10 | 27 | 30 | 48 | 20 | 49 | 33 |
| 1994 | 18 | 1 | 9 | 15 | 1 | 21 | 1 | 1 | 0 | 9 | 9 | 0 |
| 1995 | 0 | 0 | 5 | 10 | 1 | 0 | 0 | 1 | 0 | 0 | 0 | 3 |
| 1996 | 6 | 1 | 13 | 12 | 11 | 1 | 19 | 0 | 0 | 1 | 27 | 3 |
| 1997 | 148 | 0 | 10 | 7 | 33 | 13 | 17 | 4 | 0 | 42 | 27 | 7 |
| 1998 | 54 | 46 | 38 | 5 | 53 | 43 | 39 | 0 | 7 | 0 | 0 | 26 |
| 1999 | 42 | 17 | 0 | 16 | 23 | 7 | 52 | 10 | 18 | 16 | 30 | 0 |
| 2000 | 0 | 0 | 0 | 8 | 0 | 0 | 11 | 1 | 1 | 13 | 0 | 0 |
| 2001 | 0 | 1 | 14 | 19 | 6 | 1 | 1 | 1 | 1 | 7 | 4 | 11 |
| 2002 | 20 | 11 | 1 | 15 | 28 | 23 | 1 | 1 | 44 | 8 | 1 | 22 |
| 2003 | 1 | 7 | 14 | 27 | 64 | 4 | 45 | 41 | 25 | 13 | 38 | 11 |
| 2004 | 10 | 1 | 1 | 51 | 5 | 21 | 24 | 8 | 21 | 14 | 3 | 2 |
| 2005 | 1 | 3 | 1 | 10 | 1 | 24 | 16 | 35 | 18 | 5 | 19 | 12 |
| 2006 | 7 | 16 | 15 | 38 | 7 | 14 | 2 | 13 | 1 | 1 | 16 | 2 |
| 2007 | 1 | 10 | 2 | 33 | 15 | 12 | 20 | 32 | 3 | 2 | 14 | 19 |
| 2008 | 4 | 2 | 25 | 12 | 29 | 14 | 7 | 3 | 17 | 3 | 21 | 22 |
| 2009 | 36 | 75 | 78 | 107 | 33 | 43 | 30 | 22 | 7 | 22 | 31 | 43 |
| 2010 | 53 | 37 | 55 | 47 | 40 | 76 | 14 | 35 | 54 | 40 | 64 | 104 |
| 2011 | 49 | 46 | 50 | 49 | 43 | 42 | 26 | 35 | 76 | 132 | 167 | 164 |
| 2012 | 101 | 124 | 119 | 78 | 55 | 90 | 32 | 45 | 62 | 109 | 127 | 84 |
| 2013 | 136 | 78 | 98 | 119 | 187 | 97 | 135 | 70 | 78 | 202 | 139 | 197 |
| 2014 | 55 | 113 | 183 | 142 | 80 | 34 | 27 | 75 | 40 | 71 | 77 | 175 |
| 2015 | 80 | 219 | 136 | 167 | 152 | 184 | 224 | 234 | 206 | 215 | 247 | 237 |
| 2016 | 239 | 266 | 242 | 272 | 218 | 95 | 192 | 92 | 110 | 252 | 243 | 213 |
| 2017 | 333 | 611 | 387 | 452 | 384 | 272 | 208 | 354 | 531 | 773 | 499 | 576 |
| 2018 | 523 | 606 | 703 | 558 | 494 | 554 | 513 | 130 | 52 | 107 | 62 | 203 |
| 2019 | 93 | 177 | 129 | 80 | 300 | 424 | 286 | 300 | 317 | 36 | 133 | 78 |
| 2020 | 98 | 82 | 241 | 414 | 1,487 | 878 | 896 | 788 | 1,053 | 993 | 663 | 947 |
| 2021 | 808 | 457 | 848 | 602 | 715 | 645 | 549 | 549 | 492 | 647 | 787 | 463 |
| 2022 | 430 | 790 | 599 | 646 | 502 | 479 | 669 | 757 | 554 | 869 | 731 | 671 |
| 2023 | 773 | 956 | 1,478 | 1,331 | 805 | 914 | 873 | 763 | 1,055 | 1,162 | 946 | 681 |
| 2024 | 867 | |||||||||||
| - = No Data Reported; -- = Not Applicable; NA = Not Available; W = Withheld to avoid disclosure of individual company data. |
| Release Date: 3/29/2024 |
| Next Release Date: 4/30/2024 |