|
Download Data (XLS File) |
|
||||||||
|
||||||||
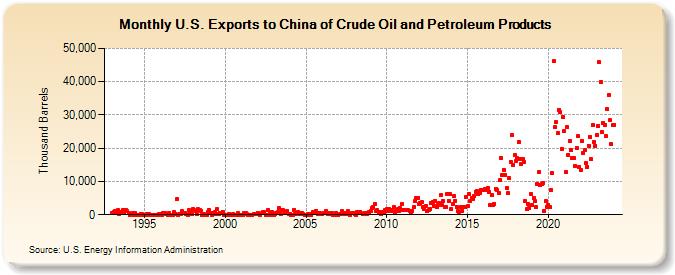
| U.S. Exports to China of Crude Oil and Petroleum Products (Thousand Barrels) | ||||||||
| Year | Jan | Feb | Mar | Apr | May | Jun | Jul | Aug | Sep | Oct | Nov | Dec |
|---|---|---|---|---|---|---|---|---|---|---|---|---|
| 1993 | 456 | 834 | 981 | 539 | 1,320 | 302 | 822 | 917 | 1,433 | 633 | 1,484 | 1,010 |
| 1994 | 566 | 16 | 281 | 443 | 16 | 643 | 43 | 26 | 3 | 275 | 259 | 6 |
| 1995 | 2 | 3 | 162 | 296 | 35 | 5 | 3 | 19 | 5 | 4 | 3 | 96 |
| 1996 | 193 | 38 | 418 | 368 | 354 | 40 | 587 | 2 | 7 | 44 | 807 | 98 |
| 1997 | 4,584 | 4 | 301 | 220 | 1,018 | 377 | 528 | 139 | 9 | 1,299 | 806 | 217 |
| 1998 | 1,687 | 1,299 | 1,188 | 157 | 1,628 | 1,295 | 1,208 | 5 | 206 | 6 | 11 | 814 |
| 1999 | 1,295 | 482 | 6 | 494 | 720 | 214 | 1,617 | 310 | 534 | 485 | 909 | 9 |
| 2000 | 10 | 9 | 9 | 254 | 9 | 7 | 347 | 22 | 21 | 406 | 6 | 6 |
| 2001 | 6 | 41 | 420 | 564 | 197 | 29 | 26 | 34 | 27 | 229 | 129 | 342 |
| 2002 | 628 | 319 | 19 | 446 | 873 | 685 | 16 | 16 | 1,321 | 253 | 27 | 677 |
| 2003 | 25 | 209 | 432 | 799 | 1,998 | 126 | 1,395 | 1,283 | 748 | 415 | 1,142 | 343 |
| 2004 | 322 | 32 | 46 | 1,522 | 159 | 636 | 757 | 247 | 633 | 424 | 91 | 47 |
| 2005 | 21 | 84 | 43 | 293 | 35 | 724 | 505 | 1,084 | 536 | 165 | 560 | 358 |
| 2006 | 219 | 449 | 460 | 1,152 | 228 | 434 | 77 | 394 | 27 | 27 | 466 | 52 |
| 2007 | 37 | 280 | 67 | 979 | 462 | 359 | 633 | 986 | 101 | 51 | 424 | 591 |
| 2008 | 118 | 53 | 776 | 372 | 908 | 428 | 231 | 78 | 505 | 97 | 637 | 671 |
| 2009 | 1,111 | 2,094 | 2,427 | 3,224 | 1,027 | 1,283 | 941 | 674 | 216 | 686 | 926 | 1,345 |
| 2010 | 1,652 | 1,027 | 1,703 | 1,413 | 1,252 | 2,293 | 432 | 1,097 | 1,630 | 1,254 | 1,923 | 3,217 |
| 2011 | 1,523 | 1,282 | 1,545 | 1,461 | 1,331 | 1,263 | 816 | 1,098 | 2,287 | 4,077 | 5,000 | 5,074 |
| 2012 | 3,116 | 3,582 | 3,683 | 2,353 | 1,719 | 2,694 | 985 | 1,398 | 1,862 | 3,374 | 3,801 | 2,609 |
| 2013 | 4,227 | 2,184 | 3,052 | 3,566 | 5,805 | 2,916 | 4,195 | 2,175 | 2,331 | 6,274 | 4,169 | 6,101 |
| 2014 | 1,698 | 3,165 | 5,666 | 4,249 | 2,467 | 1,026 | 842 | 2,333 | 1,198 | 2,211 | 2,295 | 5,420 |
| 2015 | 2,493 | 6,123 | 4,223 | 5,004 | 4,718 | 5,523 | 6,938 | 7,247 | 6,185 | 6,656 | 7,412 | 7,343 |
| 2016 | 7,416 | 7,700 | 7,490 | 8,149 | 6,756 | 2,845 | 5,948 | 2,846 | 3,314 | 7,817 | 7,288 | 6,590 |
| 2017 | 10,309 | 17,111 | 11,998 | 13,569 | 11,910 | 8,173 | 6,447 | 10,972 | 15,937 | 23,951 | 14,962 | 17,855 |
| 2018 | 16,214 | 16,969 | 21,794 | 16,743 | 15,326 | 16,627 | 15,890 | 4,028 | 1,570 | 3,311 | 1,873 | 6,288 |
| 2019 | 2,891 | 4,955 | 4,010 | 2,401 | 9,303 | 12,727 | 8,879 | 9,310 | 9,509 | 1,119 | 3,992 | 2,407 |
| 2020 | 3,032 | 2,389 | 7,468 | 12,424 | 46,090 | 26,329 | 27,789 | 24,441 | 31,603 | 30,792 | 19,888 | 29,364 |
| 2021 | 25,041 | 12,808 | 26,302 | 18,072 | 22,174 | 19,345 | 17,010 | 17,010 | 14,746 | 20,057 | 23,610 | 14,344 |
| 2022 | 13,341 | 22,109 | 18,563 | 19,395 | 15,563 | 14,384 | 20,753 | 23,463 | 16,621 | 26,940 | 21,929 | 20,807 |
| 2023 | 23,972 | 26,757 | 45,826 | 39,922 | 24,951 | 27,430 | 27,066 | 23,640 | 31,658 | 36,014 | 28,383 | 21,109 |
| 2024 | 26,882 | |||||||||||
| - = No Data Reported; -- = Not Applicable; NA = Not Available; W = Withheld to avoid disclosure of individual company data. |
| Release Date: 3/29/2024 |
| Next Release Date: 4/30/2024 |