|
Download Data (XLS File) |
|
||||||||
|
||||||||
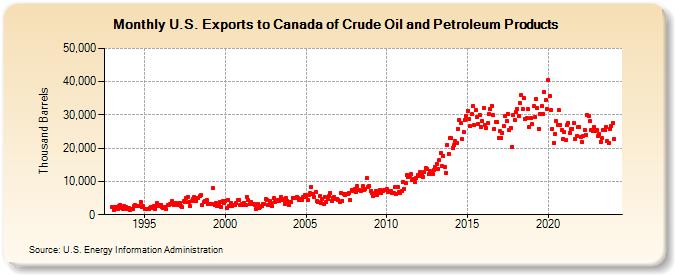
| U.S. Exports to Canada of Crude Oil and Petroleum Products (Thousand Barrels) | ||||||||
| Year | Jan | Feb | Mar | Apr | May | Jun | Jul | Aug | Sep | Oct | Nov | Dec |
|---|---|---|---|---|---|---|---|---|---|---|---|---|
| 1993 | 2,369 | 1,457 | 2,171 | 2,395 | 1,835 | 2,617 | 3,065 | 2,003 | 1,670 | 2,523 | 2,436 | 1,694 |
| 1994 | 1,928 | 1,419 | 1,764 | 1,612 | 2,523 | 2,988 | 2,499 | 2,640 | 2,610 | 3,859 | 2,203 | 2,568 |
| 1995 | 1,707 | 1,646 | 1,790 | 1,707 | 1,976 | 2,279 | 2,068 | 2,483 | 1,785 | 3,470 | 2,572 | 3,022 |
| 1996 | 2,969 | 2,369 | 2,069 | 2,383 | 1,644 | 2,989 | 2,917 | 3,145 | 3,983 | 3,377 | 2,982 | 3,458 |
| 1997 | 3,316 | 3,009 | 3,667 | 2,545 | 2,190 | 4,037 | 3,782 | 5,172 | 5,340 | 3,773 | 2,609 | 4,111 |
| 1998 | 4,702 | 5,447 | 4,231 | 4,983 | 4,881 | 5,487 | 5,873 | 2,852 | 3,730 | 4,072 | 4,346 | 3,295 |
| 1999 | 3,165 | 3,075 | 3,284 | 7,926 | 2,826 | 3,448 | 2,591 | 3,183 | 3,887 | 2,308 | 4,093 | 3,572 |
| 2000 | 3,992 | 2,086 | 4,547 | 2,497 | 3,651 | 2,544 | 2,911 | 2,970 | 3,405 | 4,323 | 4,359 | 3,066 |
| 2001 | 3,215 | 2,974 | 3,652 | 2,982 | 5,355 | 4,380 | 3,301 | 3,891 | 3,088 | 3,325 | 2,833 | 1,796 |
| 2002 | 3,172 | 1,983 | 2,447 | 2,624 | 3,216 | 3,152 | 4,648 | 4,534 | 2,845 | 4,147 | 3,479 | 2,568 |
| 2003 | 4,914 | 3,719 | 3,988 | 4,481 | 4,166 | 5,394 | 4,787 | 4,527 | 3,263 | 5,037 | 4,053 | 3,003 |
| 2004 | 3,874 | 3,796 | 5,147 | 5,101 | 4,934 | 5,334 | 4,910 | 4,560 | 4,601 | 4,327 | 5,264 | 5,921 |
| 2005 | 5,354 | 4,458 | 5,944 | 6,416 | 8,368 | 6,122 | 5,425 | 6,742 | 4,229 | 3,793 | 5,534 | 3,584 |
| 2006 | 4,695 | 3,300 | 5,256 | 3,777 | 4,843 | 5,483 | 6,613 | 4,140 | 5,059 | 5,191 | 4,788 | 4,860 |
| 2007 | 4,451 | 3,925 | 6,392 | 4,208 | 6,183 | 5,915 | 6,285 | 6,195 | 6,575 | 4,396 | 7,374 | 7,073 |
| 2008 | 7,761 | 6,779 | 8,525 | 7,316 | 7,323 | 7,199 | 8,545 | 7,539 | 7,594 | 11,129 | 8,189 | 8,627 |
| 2009 | 7,031 | 6,413 | 5,520 | 6,353 | 7,185 | 6,010 | 6,848 | 7,507 | 6,469 | 7,201 | 7,327 | 7,408 |
| 2010 | 7,697 | 6,712 | 7,108 | 7,246 | 6,668 | 6,565 | 8,206 | 6,292 | 8,342 | 6,750 | 6,565 | 7,012 |
| 2011 | 9,981 | 7,773 | 9,457 | 11,977 | 11,254 | 11,589 | 12,116 | 10,444 | 10,816 | 9,952 | 10,994 | 11,922 |
| 2012 | 11,553 | 12,833 | 11,941 | 11,456 | 12,824 | 14,070 | 13,713 | 12,150 | 13,047 | 12,946 | 12,260 | 13,519 |
| 2013 | 14,277 | 15,390 | 13,810 | 16,358 | 18,520 | 14,587 | 17,607 | 14,483 | 12,663 | 21,022 | 18,350 | 23,205 |
| 2014 | 23,044 | 20,134 | 20,861 | 22,053 | 21,521 | 25,893 | 28,460 | 27,592 | 22,630 | 24,987 | 28,595 | 29,595 |
| 2015 | 31,308 | 28,694 | 26,633 | 30,172 | 32,545 | 27,000 | 31,378 | 29,232 | 27,334 | 30,083 | 26,254 | 28,071 |
| 2016 | 31,934 | 26,933 | 26,045 | 27,554 | 30,227 | 31,921 | 32,813 | 29,869 | 25,915 | 28,010 | 27,826 | 23,187 |
| 2017 | 25,083 | 23,155 | 24,609 | 26,550 | 29,662 | 28,074 | 30,390 | 25,533 | 26,151 | 20,308 | 29,960 | 28,456 |
| 2018 | 30,909 | 31,775 | 29,716 | 33,464 | 36,013 | 31,868 | 34,941 | 28,920 | 28,964 | 31,707 | 26,262 | 29,049 |
| 2019 | 27,208 | 32,562 | 29,256 | 34,660 | 31,944 | 25,843 | 30,361 | 32,603 | 30,398 | 36,879 | 34,428 | 31,808 |
| 2020 | 40,366 | 35,647 | 31,409 | 25,798 | 21,677 | 24,406 | 28,036 | 27,002 | 31,382 | 27,037 | 25,399 | 22,881 |
| 2021 | 24,723 | 22,574 | 26,851 | 27,648 | 24,657 | 25,665 | 25,874 | 27,428 | 22,856 | 23,694 | 26,239 | 26,445 |
| 2022 | 23,472 | 21,865 | 23,581 | 25,563 | 23,971 | 30,115 | 29,587 | 28,077 | 25,384 | 25,088 | 26,401 | 25,264 |
| 2023 | 25,323 | 23,704 | 24,352 | 21,955 | 22,927 | 25,547 | 25,500 | 26,410 | 22,024 | 21,437 | 25,875 | 26,735 |
| 2024 | 27,652 | |||||||||||
| - = No Data Reported; -- = Not Applicable; NA = Not Available; W = Withheld to avoid disclosure of individual company data. |
| Release Date: 3/29/2024 |
| Next Release Date: 4/30/2024 |